I wandered through Nordstom’s downtown Portland store the other day.
Take a look at some of the shoes I came across:


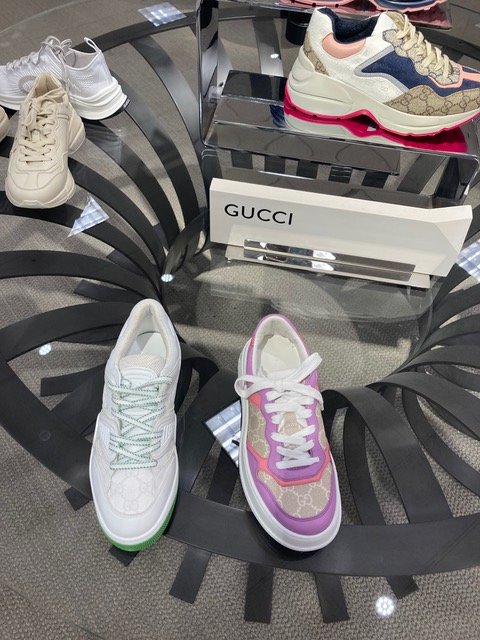


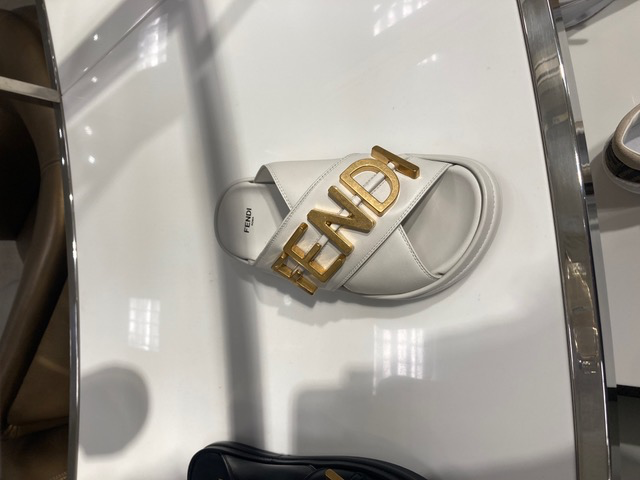
OK, but what’s so special about all these shoes? Even single one of them, including the sneakers, costs $850 or more. The Black Libelli Booties (top right) are $1795. The Fendigraphy white leather slides (bottom) are $1100.
And, by the way, big spenders looking for socks to wear with their $1000 sneakers can buy a pair of black-and-white Bottega Veneta “ghost pattern” crew socks at Nordstrom for $420. That’s right, $420.
If that’s just a bit too much, the striver can also get a pair of Balenciaga Logo Cotton Blend Socks at Nordstrom for $210 a pair or a pair of Off-White Arrow Cotton Blend Crew Socks for $120.
“The logic is, if you’re paying $1,000 for a pair of shoes, what’s $200 more?” Jian DeLeon, the men’s fashion director at Nordstrom, told the Wall Street Journal. “Lavish socks are “something you don’t need, but it’s the ultimate expression of luxury.” When you pair fancy shoes and socks, he said, it shows you’re going the “extra mile.”
It’s hard not to wonder who is buying this exorbitantly priced stuff and what it says about our economy.
Per capita income in the Portland Metro Area is just $40,138 and median household income is only $77,511.
The annual income of 31% of households is $50,000 or less. Another 31% of households have annual incomes of $50,000 – $100,000. It is probably reasonable to assume that the members of this 62% of households in the Portland Metro Area are not the ones buying $895 and over pairs of shoes.
That leaves 38% of Metro Area households earning $100,000 a year and more.
Household income
| Column | Portland-Vancouver-Hillsboro, OR-WA | Oregon | United States | |||||||||
|---|---|---|---|---|---|---|---|---|---|---|---|---|
| Under $50K | 31.2% | ±0.5% | 299,055 | ±4,613 | 38.1% | ±0.4% | 626,425 | ±6,571.7 | 39.1% | ±0.1% | 47,785,414 | ±58,302.5 |
| $50K – $100K | 30.8% | ±0.5% | 295,189 | ±4,384.3 | 31.4% | ±0.3% | 516,210 | ±5,646.9 | 30% | ±0.1% | 36,648,022 | ±63,450.6 |
| $100K – $200K | 28.1% | ±0.4% | 268,728 | ±4,128.5 | 23.2% | ±0.3% | 381,343 | ±4,795.5 | 22.7% | ±0.1% | 27,817,092 | ±73,446.1 |
| Over $200K | 9.9% | ±0.2% | 95,005 | ±2,140 | 7.2% | ±0.2% | 118,601 | ±2,840 | 8.3% | ±0% | 10,103,691 | ±51,548 |
I assume the buyers of high-priced items like the shoes above come from that segment of the population. But are enough of them so blasé about overall economic conditions to be drawn into buying extravagant goods?
The answer seems to be yes.
The middle class, once the economic stratum of a clear majority of American adults, has steadily contracted in the past five decades, according to a new Pew Research Center analysis of government data. The share of adults who live in middle-class households fell from 61% in 1971 to 50% in 2021. Although household incomes have risen substantially since 1970, those of middle-class households have not climbed nearly as much as those of upper-income households.
On Sept. 27, 2022, the Congressional Budget Office issued a study of trends in the distribution of family wealth between 1989 and 2019. In that period, total real wealth held by families tripled from $38 trillion to $115 trillion.
But the distribution of that growth was uneven.
Money moved toward the families in the top 10%, and especially in the top 1%, shifting from families with less income and education toward those with more wealth and education. In the 30 years examined, the share of wealth belonging to families in the top 10% increased from 63% in 1989 to 72% in 2019, from $24.3 trillion to $82.4 trillion (an increase of 240%). The share of total wealth held by families in the top 1% increased from 27% to 34% in the same period. In 2019, families in the bottom half of the economy held only 2% of the national wealth, and those in the bottom quarter owed about $11,000 more than they owned.
As the New York Times recently observed, “Higher-income households built up savings and wealth during the early stages of the pandemic as they stayed at home and their stocks, houses and other assets rose in value. Between those stockpiles and solid wage growth, many have been able to keep spending even as costs climb. But data and anecdotes suggest that lower-income households, despite the resilient job market, are struggling more profoundly with inflation.”
Even during the pandemic, when most Americans fared well financially, the rich saw most of the gain. According to the Federal Reserve, while American households overall saw about $13.5 trillion added to their wealth, the top 1% got a third of that and the top 20% 70% of it.
As the Wall Street Journal recently reported, even though the United Status is technically in a recession, and consumer confidence isn’t great, the demand for expensive luxury goods, such as handbags and jewelry, is off the charts
“Spending by Americans and Europeans is roaring, despite headlines of all-time-low consumer sentiment in the eurozone and greater caution in the U.S.,” reported the Journal. “Many luxury brands have more than doubled the size of their sales in America compared with prepandemic levels. Because of their wealthier customers, luxury brands might be more immune to the challenges other businesses now face.”
Luxury company LVMH Moët Hennessy Louis Vuitton (LVMH), whose brand stable includes Christian Dior, Louis Vuitton and Tiffany, reported a rise in sales at all its divisions in the first half of 2022. Growth was strongest in the fashion and leather goods unit, the company’s biggest, where first-half sales rose 31% year-over-year to €18.1 billion. U.S. revenues gained 24%.
U.S. credit card data from Bank of America shows that shoppers earning less than $50,000 a year are rethinking their priorities as inflation hits everyday expenses, but this has been more than offset by demand from core luxury spenders.
Then there’s the desire of some people to be noticed, to display their wealth, even if the items on display are rather bizarre or not particularly attractive. I call this the “Sure it’s ugly, but it’s expensive” syndrome.
It’s the weirdness itself that has appeal.
It’s not that people want an ugly or bizarre watch or pair of shoes. What they want is to stand out, to have their friends, neighbors and even strangers see their distinctive, peculiar, expensive accoutrements.
Oh well, at least people blowing all their money on overpriced things are keeping the people who make them employed. And that’s good, right?

