Government just can’t seem to stop wanting more money.
In a strange twist, now there’s a move to make life less affordable for many Oregonians in order to promote affordable housing.
Oregon Governor Tina Kotek’s Housing Production Advisory Council has just submitted a 20-page draft report, HPAC Policy Recommendations, on ideas on how to address the affordable housing crisis. And, of course, the ideas include raising more money. The Taxpayer Association of Oregon revealed the report on Jan. 10, 2024.
Remember when voters passed Measure 50 in 1997? It introduced maximum assessed value (MAV), which acts as a “cap” on the growth of taxable (assessed) value for most property. MAV growth is limited to 3 percent per year. Combined with permanent tax rates, Measure 50 effectively limited tax increases, except under specific circumstances. Kotek’s Housing Production Advisory Council is proposing raising that to 5%.
Own a vacation property in Bend? Kotek’s Housing Production Advisory Council is proposing eliminating the Mortgage Interest Deduction for Second Homes (i.e., abolishing the income tax deduction for interest paid on second homes).
Drive a gas car? Kotek’s Housing Production Advisory Council is proposing doubling fuel taxes.
On section 7 (Page 16/17) it lists 5 suggestions to raise new revenue (as shown below):
Generate new, state-level revenue to fund critical local infrastructure. a. New revenue generation to be limited to duration of HPAC Timeline (i.e., sunset in 2032) and in support of the related work plan topics described below. Potential sources include:
i. Revenue Source and Annual Revenue Generated (Legislative Revenue Office, 2023, p. B7, FY 23-24 dollars).
Increase all personal income tax brackets by ½ percentage point. a. $699 Million
Establish Special $1 per $1,000 real property tax assessment outside of Measure 5. a. $504 Million
Implement 0.5% Retail Sales Tax. a. $501 Million
Implement 0.5% Payroll Tax. a. $620 Million
Double Fuel Tax. a. $686 Million
The report also proposes:
Reform Oregon’s tax system to encourage development of needed housing and provide adequate revenue for local governments to support housing production. a. Taxes are both a tool to raise revenue for government and to shape taxpayer behavior. Attaining the Governor’s desired housing production goals will require significant new revenue; this recommendation highlights actions that can address revenue shortfalls and encourage a shift in taxpayer behavior to support housing production. b. Potential actions include (but are not limited to): i. Targeted Measure 50 Reform:
Increase annual Maximum Assessed Value change to 5%.
Authorize voters to increase the permanent levy of their local jurisdiction.
Exempt Cites and Counties from compression. ii. Adopt Land Value Tax iii. Eliminate Mortgage Interest Deduction for Second Homes (i.e., abolish income tax deduction for interest paid on second homes). iv. Enact temporary property tax exemption for new housing at 120% AMI or below. v. Reduce or Eliminate Tax Expenditures (i.e., tax exemptions) not related to housing.
The report notes that four lawmakers, from both parties, sit as members on Kotek’s Council. They are:
There are also a number of community members appointed to theCouncil by Governor Kotek.
They need to hear from taxpayers.
_______________________________________
Gubernatorial Appointments:
Co-chair J.D. Tovey – rural Oregon and an enrolled member of the Confederated Tribes of the Umatilla Indian Reservation – land use, building codes and housing development
Co-chair Damien Hall – Metro- land use, and affordable and market housing development
Daniel Bunn– Southern Oregon – land use and financing market housing
Thomas Cody– Metro area – affordable and market housing development
Deborah Flagan – Central Oregon – market housing development and construction
Ernesto Fonseca– Metro area – affordable and market housing development and financing affordable housing
Elissa Gertler– Oregon Coast – land use and financing affordable housing
Riley Hill– rural Oregon – land use and market housing development
Natalie Janney– Willamette Valley area – land use, market housing development
Robert Justus – Metro area – affordable and market housing development
Joel Madsen– Columbia Gorge – affordable housing development and financing
Ivory Mathews – Metro area – affordable housing development and financing
Erica Mills– Southern Oregon – financing affordable and market housing
Eric Olsen– Willamette Valley area – construction, market housing development
Gauri Rajbaidya– Metro area – affordable and market housing development
Karen Rockwell – Oregon Coast – affordable and market housing development
Margaret Van Vliet – Metro area – financing market and affordable housing, and affordable housing development
Justin Wood – Metro – construction and market housing development
That was one of the recommendations of Gov. Tina Kotek’s Portland Central City Task Force convened to consider the city’s most challenging problems and recommend ways to address them.
“Declare a moratorium on new taxes…” urges the Task Force report. “…elected officials should consider a three-year pause, through 2026, on new taxes and fees…”
Oh well, so much for that.
Your Portland property taxes, which were due Nov. 15, probably already went up and will likely go up again in 2024. According to the Lincoln Institute of Land Policy and the Minnesota Center for Fiscal Excellence, Portland ranked fifth highest nationally for effective property tax rate — a homeowner’s tax bill as a percentage of a property’s value — on a median-value home in 2022.
And Portland Commissioners Dan Ryan and Rene Gonzalez are already floating a November 2024 ballot measure that would raise property taxes to cover a $800 million bond for maintenance and new construction projects for the city’s parks and fire departments.
Oregonians are also already paying higher gas taxes. Oregon’s gas tax increased to 40 cents as of Jan. 1, 2024. That’s an increase of two cents per gallon from last year. The new rate keeps Oregon among the ten states in the U.S. with the highest gas taxes. Propane and Natural Gas Flat Fee increases also went into effect for qualified vehicles on Jan. 1.
Portlanders (and many more folks) are also facing increases in electricity rates. PGE customers can expect to pay 18% more on their power bills starting Jan. 1. The 2024 rate increase will cost the average single-family household an extra $24.59 each month.
And then there are all the taxes and fees the 2003 Legislature gleefully enacted.
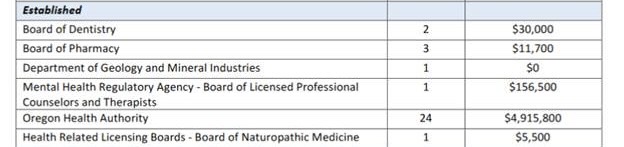
According to the Taxpayer Association of Oregon, Oregon lawmakers passed 185 fee increases (increasing existing fees and establishing new fees) in 2023 that will mean $47 million in higher costs.
Of those, 77 new or increased fees will directly impact the cost of medicine, hospitals and health care, which are all already straining the budgets of Oregonians. Another 47 fee increases will impact Oregon’s agriculture industry and consumers.
A list of 2024 fee increases by agency is below:
And then there are the new fees the 2023 Legislature created:
Portlanders and almost all Oregonians are also going to be paying a new cell phone tax this year. Starting January 1, 2024, a 988 Coordinated Crisis Services Tax will be added to the existing Oregon Emergency Communications (911) Tax. The new tax was implemented by the Oregon Legislature with the passage of House Bill 2757. The $50 million a biennium tax is slated to fund the state’s new 9-8-8 suicide prevention hotline.
DMV fees have gone up, too, touching just about everybody with a vehicle. For example:
Class C driver license or restricted Class C driver license, increased from $54 to $58
Commercial driver license, increased from $75 to $160
Instruction driver permit, increased from $23 to $30
Commercial learner driver permit, increased from $23 to $40
Hardship driver permit application, increased from $50 to $75
Fee for renewal of a commercial driver license, increased from $55 to $98
Fee for knowledge test for a motorcycle endorsement, increased from $5 to $7
Fee for a skills test for any commercial driver license, increased from $70 to $145
And the list of fee increases goes on, nickeling and diming Oregonians.
And of course legislators are busy thinking of new taxes.
For example, because the Oregon Department of Forestry wants more money to fight wildfires, Sen. Elizabeth Steiner, D-Portland, wants to charge every property owner in the state an annual fee to pay for what she perceives as a statewide issue.
And then, of course, there’s always inflation. It has been pushed down by aggressive Federal Reserve action, but in its long-term economic projections from December, the Federal Open Market Committee forecasted core Personal Consumption Expenditures Price Index inflation will drop from 3.2% in 2023 to 2.4% in 2024 and 2.2% in 2025.
But, still, hold on to your wallet. The state is considering tolls on I-205, I-5, U.S. 26 and Highway 217.
When educators from across the Portland Public Schools (PPS) district’s 81 schools began their strike on Nov. 1, they had a lengthy list of demands, with a focus on teacher salaries.
“As costs have risen here, teachers’ salaries haven’t kept up,” the National Education Association asserted in a news release supporting the PPS strike.
Data suggests, however, that Portland’s teachers were actually doing fairly well in comparison with other teachers across the country, though there is no question inflation has eroded their financial position. The same is true of Oregon teachers in general.
During the strike, PPS said the average salary for a Portland teacher was $87,000; the Portland Association of Teachers (PAT) union said it was about $83,000. Pay can vary widely depending on multiple factors, including amount of education, certifications, additional skills, and the number of years spent in the profession.
PAT also raised concerns about pay for new teachers, with the lowest annual base salary in the district for a teacher with a BA starting at $50,020.
When the strike began, PAT wanted a 23% cost-of-living adjustment over three years; PPS offered about 11%. In the new contract, educators will receive a 14.4% compounded increase over the next three years (6.25% the first year, 4.5% the second and 3% the third) and about half of all educators will also earn a 10.6% bump from yearly step increases.
To get a handle on how all this translates into actual dollars, I asked PPS and PAT for their numbers on the current average and median salaries of educators in the district and what they expect the average and median salaries of teachers will be in the first year of the new contract?
PAT never responded. PPS responded to an initial request with a commitment to provide the data. Repeated follow-ups, however, brought nothing but excuses for the delay. Eventually my entreaties just went into a black hole. So much for public accountability.
In 2018, The Oregonian reported that in 2016-17, the average Oregon teacher made nearly $61,900 a year, higher than the national average of $59,700. Oregon ranked 13th highest for average teacher pay among the 50 states. “Oregon teachers have long been better compensated than most of their peers around the country,” the paper reported.
In 2023, according to the National Education Association (NEA), the average Oregon teacher made $70,402 a year, higher than the national average of $66,745, and again Oregon ranked 13th highest for average teacher pay among the 50 states.
In other words, Oregon has actually been holding its own in average salaries, although the numbers for starting teacher pay are not as favorable for Oregon.
In 2023,the average salary for a starting teacher inOregonwith a bachelor’s degree and no experience was $40,374 (31st in the US, where the average was $42,844). Under the PPS contract with PAT, the salary for a starting teacher with a bachelor’s degree and no experience in 2023 was $50,020.
Averages, however, can be deceiving. Very high or very low salaries can skew the numbers. Median compensation represents a more accurate picture of how much Portland’s teachers are being paid, but neither PPS nor PAT agreed to provide median salary numbers.
The Oregon Center for Public Policy, a progressive economic research organization, argues that Oregon public school teachers are underpaid by about 22%. Even after accounting for the more generous benefits earned by public school teachers, the Center claims Oregon public school teachers are underpaid by about 9%.
But the analysis is not based on compensation for other teachers. Rather, the Center claims Oregon teachers are underpaid “relative to comparable private-sector workers (in Oregon)…with similar levels of education and experience”. The claim that public-school teachers endure a salary penalty with this comparison is dubious.
Less dubious was PAT’s assertion before the strike that recent inflation has eroded teachers’ wage gains over time.
In an annual report that ranked and analyzed teacher salaries by state, the NEA estimated that the national average teacher salary for the 2021-22 school year was $66,397 — a 1.7 percent increase from the previous year. But when adjusted for inflation, the average teacher salary actually decreased by an estimated 3.9 percent over the last decade.
In other words, teachers were making $2,179 less, on average, than they did 10 years earlier when the salaries are adjusted for inflation. A similar NEA report issued in 2023 concluded that teachers made on average $3,644 less than they did 10 years ago, adjusted for inflation.
However, comparing over a longer period, the average Oregon teacher’s salary in 1970 was $8,818. Inflation adjusted, that figure would have been $66,509.99 in 2022. In other words, although there has been a decrease in inflation-adjusted pay in recent years, average teacher salaries in Oregon have kept up with inflation over the long term.
Oregon’s hyper-projections for electric vehicle adoption are proving to be wishful thinking.
On Nov. 6, 2017, Gov. Kate Brown signed Executive Order 17-21 stating “It is the policy of the State of Oregon to establish an aggressive timeline to achieve a statewide goal of 50,000 or more registered and operating electric vehicles by 2020.” (emphasis in original).
In 2019, Senate Bill 1044 restated the Zero Emission Vehicle (ZEV) adoption target as 50,000 registered on Oregon roads by 2020.
It didn’t happen.
According to information provided by the Oregon Department of Transportation on Dec. 25, 2023, there were just 5,537 registered and operating electric vehicles in Oregon in 2020, 13,572 in 2021 and 23,163 in 2022.
Senate Bill 1044 also set a target of 250,000 registered Zero Emission Vehicles on Oregon roads by 2025.
That ain’t gonna happen either.
As of July 2023, there were 51,355 Battery Electric Vehicles (BEVs), vehicles powered solely by an electric battery, with no gas engine parts, registered and operating in Oregon, according to the Oregon Department of Energy.[1] The number of Oregon-registered zero emission vehicles on Oregon roads as of September 2023 was just 70,000. The likelihood that this number will grow to 250,000 over the next 12 months is nil.
In December 2022, Gov. Brown, in a burst of environmental overreach that slavishly followed California’s lead, announced that all new cars sold in Oregon would have to be emissions-free starting in 2035.
The way things are going, that’s a pipe dream.
The fact is adoption of zero emission EVs is falling far behind earlier exuberant expectations. Sales are growing, but the rate of growth is slowing and unsold inventory is piling up for multiple brands., despite car companies offering discounts and low-interest rates in an attempt to propel demand. The only segment seeing significant growth in demand is hybrids, which are not zero emission vehicles.
“The first wave of buyers willing to pay a premium for a battery-powered car has already made the purchase, dealers and executives say, and automakers arenow dealing with a more hesitant group, just as a barrage of new EV models are expected to hit dealerships in the coming years,” according to the Wall Street Journal.
Some resistance to EVs may also be emerging because of their environmental costs, particularly the need for minerals for the batteries. And as The Washington Post has pointed out, mining the minerals is only the first step.
“The ore is almost never pure and needs to be refined, or processed, to become the minerals that go into batteries, the Post reported. ” When it comes to processing, there is one major player: China, which handles more than half of the mineralscritical to EV batteries. These elements aren’t used only to power EVs; they also appear in everything from building materials to toys. But as the demand for EV components soars, so could dependency on China’s refining infrastructure.”
Resistance to EVs in Oregon may also be related to the insufficiency of charging ports. Oregon is hoping to install about 370 new electric vehicle charging ports across the state in 2024 as part of an Oregon Department of Transportation rebate program.
In the meantime, car companies are cutting back on plans for battery plants and EV production.
In mid-December, for example, Ford announced it was cutting its 2024 F-150 Lightning products by half. Ford has delayed about $12 billion in new EV investments, reducing some Mustang Mach-E production and postponing opening one of two planned Kentucky planned battery plants.
The high cost of EVs is one major factor that will likely continue to hold back their widespread adoption in Oregon. EVs remain much more expensive than internal combustion engine vehicles, especially in North America. High interest rates will also restrain purchases. Consumer frustrations with the availability of EV chargers, excessive charging times, questions about reliability and high repair costs are also undermining early robust sales predictions.
While maintenance costs for EVs are proving to be lower than for internal combustion vehicles (EV-owners spend half as much maintaining their vehicles as their gasoline-owning counterparts, according to Consumer Reports), repairs after collisions can cost thousands of dollars because the fixes tend to require more replacement parts, the vehicles are more complicated and fewer people do such repairs.
The market is reflecting the concerns about EVs as investors have responded to the changed outlook for them. The iShares Self-Driving EV and Tech ETF | IDRV, set up in July 2019, seeks to track the investment results of an index composed of developed and emerging market companies that may benefit from growth and innovation in and around electric vehicles, battery technologies and autonomous driving technologies. A $10,000 investment at the fun’s inception would have more than doubled in value to $22,815 as of Nov. 2, 2021, but had declined to $14,432.58 as of Dec. 13, 2023.
So don’t bet the farm on EV predictions by politicians and bureaucrats. Their track record so far isn’t great.
[1] There were also 23,328 Plug-in Hybrid Electric Vehicles (PHEVs) similar to a Hybrid, but with a larger battery and electric motor, plus a charging port and a gas tank, which cannot truly be considered Zero Emission Vehicles.
Shana McConville Radford of the Confederated Tribes of the Umatilla Indian Reservation has joined Gov. Tina Kotek’s administration as Oregon’s first Tribal Affairs Director.
Shana McConville Radford
I have a job for her.
Tackle the embarrassingly poor academic achievement and embarrassingly high absenteeism rates of K-12 American Indian and Alaska Native students in Oregon.[1]
Some truth-telling is essential here. It is painfully clear that Oregon’s schools are failing these young people and that somebody needs a good kick in the shins to set things right.
We need to give kids, all kids, the tools they need to make their own way. Allowing academic failure is not the way to do that.
The numbers from tests given during the 2022-2023 school year tell the story. A predominant share of the American Indian/Alaska Native students taking the tests were American Indian.
All the academic achievement numbers come from reams of data posted online by the Oregon Department of Education showing downloadable files of state assessment results in English Language Arts (ELA), Mathematics, and Science. Absenteeism figures come from data posted online by the Oregon Department of Education in Annual Performance Progress Reports on Attendance and Absenteeism.
Some of the more egregious low proficiency scores were at districts that also have chronic student absenteeism, defined by the Oregon Department of Education as absent from school for more than 10% of the academic year.
The Department requires that there be no fewer than 265 consecutive calendar days between the first and last instructional day of each school year at each grade level, so missing 10% of school days would mean missing at least 26 days.
It’s a lot of numbers, but they are worth examining closely..
Subject
Student Group
Grade Level
Percent Proficient
English Language Arts
American Indian/Alaskan Native
All Grades
25.6
English Language Arts
American Indian/Alaskan Native
Grade 3
20.5
English Language Arts
American Indian/Alaskan Native
Grade 4
24.0
English Language Arts
American Indian/Alaskan Native
Grade 5
27.2
English Language Arts
American Indian/Alaskan Native
Grade 6
22.1
English Language Arts
American Indian/Alaskan Native
Grade 7
28.7
English Language Arts
American Indian/Alaskan Native
Grade 8
25.6
English Language Arts
American Indian/Alaskan Native
Grade HS (11)
31.1
Subject
Student Group
Grade Level
Percent Proficient
Mathematics
American Indian/Alaskan Native
All Grades
13.6
Mathematics
American Indian/Alaskan Native
Grade 3
22.2
Mathematics
American Indian/Alaskan Native
Grade 4
18.2
Mathematics
American Indian/Alaskan Native
Grade 5
14.7
Mathematics
American Indian/Alaskan Native
Grade 6
10.0
Mathematics
American Indian/Alaskan Native
Grade 7
13.7
Mathematics
American Indian/Alaskan Native
Grade 8
10.9
Mathematics
American Indian/Alaskan Native
Grade HS (11)
5.7
Subject
Student Group
Grade Level
Percent Proficient
Science
American Indian/Alaskan Native
All Grades
16.3
Science
American Indian/Alaskan Native
Grade 5
14.1
Science
American Indian/Alaskan Native
Grade 8
14.7
Science
American Indian/Alaskan Native
Grade HS (11)
20.8
A review of the performance of American Indian/Alaska Native students at individual districts is also revealing.
The details below show all Oregon school districts reporting enrollment of American Indian/Alaska Native students, in all grades, 2022-2023 and the % of students proficient of those tested.
Not all districts administered the Science test. Less than 5% means fewer than 5% of students who took the test achieved Level 3 or 4 / Meets or Exceeds. Absenteeism rates for American Indian/Alaska Native students in selected districts are also noted.
Athena-Weston SD 29RJ
English language arts. 40%
Mathematics. Less than 5%
Beaverton SD 48J
English language arts. 43.3%
Mathematics. 31.8%
Science. 21.2%
Bend-LaPine Administrative SD 1
English language arts. 33.3%
Mathematics. 31.3%
Science. 36.8%
Bethel SD 52
English language arts. 25.9%
Mathematics. 20.8%
Science. 9.1%
Brookings-Harbor SD 17C
English language arts. 20%
Mathematics. Less than 5%
Science. 27.3%
Cascade SD 5
English language arts. 42.9%
Mathematics. 21.4%
Science. 20%
Centennial SD 28J
English language arts. 17.4%
Mathematics. Less than 5%
Central Point SD 6
English language arts. 32.1%
Mathematics. 17.9%
Central SD 13J
English language arts. 31.3%
Mathematics. 5.9%
Coos Bay SD 9
English language arts. 20%
Mathematics. 8.9%
Science. 25%
Corvallis SD 509J
English language arts. Less than 5%
Mathematics. 8.3%
Creswell SD 40
English language arts. 30.8%
Mathematics. 21.4%
Crook County SD
English language arts. 26.3%
Mathematics. 16.7%
Dallas SD 2
English language arts. 29.5%
Mathematics. 14.8%
Science. 12.2%
David Douglas SD 40
English language arts. 16.1%
Mathematics. 10.0%
Science. 9.1%
Dufur SD 29
English language arts. 10.5%
Mathematics. Less than 5%
Eagle Point SD 9
English language arts. 47.4%
Mathematics. 31.6%
Science. 40%
Eugene SD 4J
English language arts. 37.8%
Mathematics. 31.6%
Science. 38.5%
Forest Grove SD 15
English language arts. 25.0%
Mathematics. 16.7%
Grants Pass SD 7
English language arts. 50%
Mathematics. 7.1%
Greater Albany Public SD 8J
English language arts. 26.7%
Mathematics. 21.4%
Science. 27.3%
Gresham-Barlow SD 10J
English language arts. 35.5%
Mathematics. 17.2%
Science. 28.6%
Harney County SD 3
English language arts. 13.3%
Mathematics. 6.7%
Hillsboro SD 1J
English language arts. 32.6%
Mathematics. 23.3%
Science. 13.6%
Hood River County SD
English language arts. 29.4%
Mathematics. 5.9%
Jefferson County SD 509J
English language arts. 17.5%
Mathematics. 6.4%.
Science. 8.4%
NOTE. 49.7% of American Indian/Alaska Native students in Jefferson County SD 509J were chronically absent in the 2022-23 school year.
Junction City SD 69
English language arts. 60%
Mathematics. 30%
Klamath County SD
English language arts. 27.1%
Mathematics. 14.6%
Science. 17%
NOTE: 38.5% of the American Indian/Alaska Native students in the Klamath County SD were chronically absent in the 2022-23 school year..
Klamath Falls City Schools
English language arts. 20.8% proficient
Mathematics. 11.3%
Science. 9.1%
NOTE: 69.5% of American Indian/Alaska Native students in the Klamath Falls City Schools district were chronically absent in the 2022-23 school year.
Lincoln County SD
English language arts. 16.5%
Mathematics. 5.9%
Science. 9.3%.
NOTE: 57.9% of the American Indian/Alaska Native students in the Lincoln County SD were chronically absent in the 2022-23 school year.
McMinnville SD 40
English language arts. 45.9%
Mathematics. 40%
Science. 47.1%
Medford SD 549C
English language arts. 51.3%
Mathematics. 21.1%
Science. 29.4%
Molalla River SD 35
English language arts. 16.7%
Mathematics. 15.4%
Myrtle Point SD 41
English language arts. 30%
Mathematics. 10%
Newberg SD 29J
English language arts. Less than 5%
Mathematics. Less than 5%
North Bend SD 13
English language arts. 32%
Mathematics. 36%
Science. 33.3%
North Clackamas SD 12
English language arts. 20%
Mathematics. 17.6%
Science. 10%
North Wasco County SD 21
English language arts. 26.1%
Mathematics. 8.7%
Science. 9.1%
Oregon Trail SD 46
English language arts. 42.9%
Mathematics. 28.6%
Pendleton SD 16
English language arts. 27.8%
Mathematics. 9.1%
Science. 14%
NOTE: 51.3% of the American Indian/Alaska Native students in the Pendleton SD 16 district were chronically absent. in the 2022-23 school year.
Phoenix-Talent SD 4
English language arts. 9.1%
Mathematics. Less than 5%
Portland SD 1J
English language arts. 17.2%
Mathematics. 11.6%
Science. 15.2%
NOTE: 66.1% of the American Indian/Alaska Native students in the Portland SD 1J district were chronically absent in the 2022-23 school year.
Redmond SD 2J
English language arts. 40.0%
Mathematics. 26.7%
Reynolds SD 7
English language arts. 23.3%
Mathematics. 13.3%
Science. Less than 5%
Salem-Keizer SD 24J
English language arts. 21.8%
Mathematics. 8.5%.
Science. 18.3%
NOTE: 58.2% of the American Indian/Alaska Native students in Salem-Keizer SD 24J district were chronically absent in the 2022-23 school year.
Santiam Canyon SD 129J
English language arts. 20%
Mathematics. 20%
Sheridan SD 48J
English language arts. 12.9%
Mathematics. 6.7%
Science. Less than 5%
South Lane SD 45J3
English language arts. 12.5%
Mathematics. 12.5%
South Umpqua SD 19
English language arts. 20%
Mathematics. 10%
Springfield SD 19
English language arts. 31.4%
Mathematics. 13.9%
Science. 29.4%
St Helens SD 502
English language arts. 18.8%
Mathematics. 6.7%
Sutherlin SD 130
English language arts. 13.3%
Mathematics. 13.3%
Three Rivers/Josephine County SD
English language arts. 27.9%
Mathematics. 11.6%
Science. 5.3%t
Tigard-Tualatin SD 23J
English language arts. 33.3%
Mathematics. 33.3%
Umatilla SD 6R
English language arts. 20%
Mathematics. 10%
Willamina SD 30J
English language arts. 25.4%
Mathematics. 8.7%
Science. Less than 5%
Winston-Dillard SD 116
English language arts. 23.1%
Mathematics. 16.7%
[1] American Indian/Alaskan Native– As defined by the Oregon Department of Education, includes all students identified as having origins in any of the original peoples of North America and not Hispanic.
In 2022, when Portland voters considered Ballot Measure 26-228 proposing transformational changes to city government, the City Budget Office estimated the cost of implementing the measure would be $910,000 to $8.7 million annually.
“The range of the cost estimate is dependent on policy decision making outside the charter scope,” the Charter Review Commission said.
Talk about buying a pig in a poke. To say the least, that left a lot of wiggle room.
Based on discussions to date, you can count on the final number being on the high end.
First, even the City Budget Office’s number is a ballpark estimate at best. As the Office said, “It is essential to note that the figures in this report are estimates and this report does not represent a budget document. Costs associated with council and mayor staffing levels, ranked choice voting implementation, and other election-related costs will only be known after certain operational milestones.”
Unknown’s, for example, are costs associated with the new ranked choice voting system, including voter education and outreach and changes in the Small Donor Elections program that provides candidates who have broad community support and follow program rules with up to a 9-to-1 match on the first $20 of small donations they receive from Portland residents.
On top of that, according to Willamette Week, an emerging sticking point is renovation of City Hall to accommodate the City Council’s expansion from a mayor and 4 commissioners to a mayor and 12 commissioners elected to represent four new geographic districts.
From 5 to 13
Despite nearly a third of Portland’s downtown office market sitting vacant, and companies potentially reducing their footprint in more than 500,000 square feet of leased space that is set to expire market-wide during the balance of 2023, the city has budgeted up to $7.2 million to renovate City Hall to accommodate the council’s expansion.
That renovation does not take into account the potential cost of establishing an individual office for each of the 12 commissioners within their district.
Meanwhile, Mayor Wheeler has proposed spending $893,000 – $1.4 million to relocate commissioners’ offices to another city building during the City Hall renovation.
Then there’s the need to plan for a City Administrator and that person’s staff. The Administrator will be responsible for implementing the laws approved by the City Council and manage the city’s bureaus.
Mayor Wheeler has proposed that the City Administrator have an assistant city administrator and five deputies who would each oversee groups of the city’s bureaus. There are currently 26 bureaus, but that could change. Presumably, the City Administrator, Deputy City Administrator and the five deputies would also have administrative assistants of some sort.
Then there’s the issue of paying the mayor and the 12 city commissioners. Their initial pay has been set by an independent salary commission that was appointed in Jan. 2023.
In June 2023, the salary commission decided to give all of Portland’s elected officials big pay raises under the new governance system. The annual base pay for all incoming City Council members will be $133,207, $7,513 more than the current rate. The mayor’s annual base pay will be $175,463, a $26,202 raise. The salaries will go into effect in January 2025.
The salary commission was not responsible for proposing how the city should pay the new salaries. The current City Council will have to figure that out.
Then there will be the staff of the mayor and each of the 12 commissioners. Currently, each city commissioner’s office has eight employees, including the commissioner, a chief of staff, and other aides performing a variety of duties.
Under Portland’s Adopted Budget for 2023-2024, three of the commissioners have a budget for 8 full-time positions and one (Dan Ryan) has a budget for 9 full-time positions::
Commissioner of Public Affairs, Rene Gonzales: $724,246
Commissioner of Public Safety, Mingus Mapps: $740,085
Commissioner of Public Utilities, Carmen Rubio: $775,038
Commissioner of Public Works, Dan Ryan: $761,405
In 2022, the City Budget Office assumed each of the twelve new offices would have between 3 and 4.7 full-time equivalent staff members supporting the Councilor and that each district of 3 representatives would have some level of shared staff providing communications and business operations functions.
Mayor Wheeler has proposed that each of the 12 councilors have two aides and some shared staff. Three of the current City Council members have proposed that each of the 12 Council members have just one staff person and that there be some administrative staff to serve all the council members.
If the number lands at the total envisioned by the City Budget Office or Mayor Wheeler, be prepared to for higher costs with such an elaborate expanded city government and for calls for more staff as the 12 individual commissioners press for more power.
And get ready for more waste as time goes on.
As humorist P.J. O’Rourke put it, “It is a popular delusion that the government wastes vast amounts of money through inefficiency and sloth. Enormous effort and elaborate planning are required to waste this much money.”
Earlier this year, Gov. Tina Kotek and the Democratic Party of Oregon were under pressure to return a $500,000 contribution to the party in 2022 from Nishad Singh, the 27-year-old wunderkind director of engineering at FTX, the disgraced and now bankrupt crypto company.
John Ray III, the new boss of the bankrupt crypto exchange FTX, pushed to get the money back, but the party stalled, likely hoping the passage of time would diminish any public pressure to return Singh’s donation.
But the pressure didn’t let up. Finally, in June 2023 the party paid the piper, repaying the $500,000 to federal authorities, but not from the party’s coffers. Instead, the money came from the campaign accounts of Gov. Kotek, Sen Ron Wyden (D-OR), Sen. Jeff Merkley (D-OR) and three unnamed Democratic U.S. House members.
Rep. Val Hoyle, (D-OR), elected to the House of Representatives in Nov. 2022 by Oregon’s 4th Congressional District, could learn something from all this.
Don’t count on running out the clock on malfeasance.
Hoyle is trying to pull the same delaying tactics in a situation where the state’s Bureau of Labor and Industries (BOLI) wants her to turn over her personal cellphones so the state can probe them for messages relating to state business Hoyle may have conducted outside public scrutiny when she was Labor Commissioner. In particular, BOLI is interested in any communications related to the controversial cannabis dispensary chain, La Mota.
Hoyle has resisted complying with the state’s request, insisting, instead, that she would review her personal devices and determine what was relevant to turn over to the state.
Talk about the fox wanting to guard the henhouse.
“She’s obligated to turn over those devices so they can be properly searched,” Ginger McCall, who served as Oregon’s public records advocate during 2018-19, told Willamette Week. “I don’t think that the public should have to trust her to do her own search, because obviously there’s a conflict of interest there on her part.”
Hoyle’s intransigence makes it look like she has something to hide. She’s be wise to learn from the FTX case that stalling won’t work. We’ll shame her until she gives in.
If you think Portland and Multnomah County’s homeless crisis is chewing through money, you probably ain’t seen nothin’ yet.
Like the ravenous plant, Aubrey II, in the Little Shop of Horrors, its unbridled appetite for more money and more employees just keeps growing.
The Joint Office of Homeless Services, a collaboration between the city of Portland and Multnomah County, was created in 2016. In FY 2017 the Joint Office received a total allocation of $48.3 million from the city and county.
City funding for JOHS programs included $6.7 million for “Rapid Rehousing” that aims to make homelessness a short-lived experience for recently houseless individuals; $5.8 million on “Supportive Housing” to help individuals gain access to housing and preventative services; and $8.0 million on “Safety Off the Streets” to pay for shelters and services for victims of domestic violence, youth, women and families. The bureau also directed $736,825 to prevent seniors and people with disabilities from becoming homeless, divert at-risk individuals from coming into contact with the criminal justice system, and expand tenant protections.
While the extent of homelessness was sobering, the mood was hopeful.
“A greater focus on management and results – in addition to sustained funding – will be needed to ensure that the region is making the most of its investment to help Portland’s most in need,” an early performance report said.
“…the department has a clear road map to expanding services that reduce chronic and episodic homelessness, with priority given to strategies that eliminate racial disparities, the Joint Office said in its FY2023 Adopted Budget.
Whatever that “clear roadmap” has been, it has cost a growing pile of money, up almost 550% since 2017, and a blistering July 2023 report from Multnomah County’s auditor alleges that the Joint Office is a mess.
As OPB has put it, “…a peek behind the scenes of the joint office reveals how clunky contract management, poor communication, insufficient data collection, and lack of vision have undermined the program’s effectiveness at solving one of the region’s most entrenched challenges.”
And now another scathing review from Health Management Associates of Oregon (HMA), requested by Multnomah County Commission Chair Jessica Vega Pederson , noted:
a lack of alignment among elected leaders, county leaders, providers and service and housing providers regarding the appropriate components of the homelessness response system
a lack of a cohesive, effective governance of the Homelessness Response System
Uncoordinated systems provide fragmented care for shared clients, leading to returns to homelessness and poor outcomes
a lack of timely communication with stakeholders and sometimes finding out news through the media,
a lack of role clarity, decision-making and organizational structure within the JOHS
According to Multnomah County’s Press Office, ” The Joint Office contract with HMA is for two years, from May 2023 to June 2025. The total cost is $140,000. The contract involves the review today alongside work to accomplish the steps laid out in the review.” Why two simultaneous reviews are necessary, one of which cost the Joint Office money, is not clear.
Tracking the Joint Office’s budgets over the years is difficult because online reports from the office have numbers for given years that are all over the map, a sign, perhaps, of its dysfunction.
What is clear is the Joint Office’s FY 2023 Adopted Budget is $262.4 million. The budget increases over the years have been accompanied by a concomitant increase in staffing, from 13 full time equivalent positions in 2016 to 45 in FY 2021 and 96 in FY 2023.
Has the homeless count gone down with the commitment of all this money and personnel?
A 2015 Point-In-Time report said 3,800 individuals were homeless in Multnomah County on any given night.
After eight years of work and millions of dollars spent by the Joint Office of Homeless Services, the number of people considered homeless in the most recent Point-In-Time Count in Multnomah County, conducted Jan. 25-31, 2023?
In the 2015-16 school year, alarms went off when one in six K-12 children were chronically absent at Oregon’s public schools..
The legislature was so concerned it enacted a bill which directing the Oregon Department of Education and the Chief Education Office to jointly develop a statewide education plan to address the problem.
So much for that.
In the 2021-2022 school year, the most recent year for which data is available, 36.1% of Oregon’s K-12 students were chronically absent from school, absent for more than 10% of the academic year. Only Hawaii at 37%, Michigan at 38.5% and the District of Columbia at 48.1%, had higher rates of chronic absenteeism.
Children who are chronically absent in their early years of schooling are likelier than their peers to struggle to read at grade level by the end of second grade and students still struggling at the end of third grade are four times more likely to drop out of high school, according to research supported by the Annie E. Casey Foundation and the Center for Demographic Analysis, University at Albany, State University of New York.
For the worst readers, those who could not master even the basic skills by third grade, the rate is nearly six times greater.
By the ninth grade, every week a student misses reduces that student’s chance of graduating by about 20 percentage points.
“The fact that absenteeism has gone up is the biggest issue right now and has been overlooked,” says the Lewis-Sebring Director of the UChicago Consortium on School Research, Elaine Allensworth. “People keep focusing on the test scores, but our research shows over and over again that student attendance is an incredibly strong predictor of pretty much every outcome you care about: High school graduation, college ready, college enrollment, college graduation. It’s vital that students actually come to school every day.”
Oregon media have reported on rising absenteeism, but the general take has been that it is a system-wide problem. What they’ve mostly missed is the high rates of absenteeism among kids of color.
An exhaustive review of Oregon Department of Education data on absenteeism at Oregon school districts in the 2021-2022 school year reveals substantial differences in rates of absenteeism between white students and students of color.
“The long-term consequences of disengaging from school are devastating,” says Hedy Chang, executive director of Attendance Works, a nonprofit addressing chronic absenteeism. For children of color, the consequences can be particularly severe.
In other words, for all the money Oregon is pouring into its schools to improve the academic performance of kids of color, it’s not going to make any damn difference if kids of color don’t show up.
It looks like the really tiny town of Mitchell (pop. approx. 137) in a rugged Eastern Oregon canyon has figured out how to bring in big bucks – sponsor public virtual schools.
Mitchell, Oregon
Since Oregon enacted a charter school law in 1999, virtual charters in the state have spread like a rash, with 20 now offering online courses to some or all grades of K-12 students. Enrollment at the virtual charters in 2022-2023 was 15,711, representing 37.79% of total charter school enrollment.
Charter schools in Oregon, including virtual charters, are publicly funded, so parents don’t pay tuition. Instead, the Oregon Department of Education distributes money from the State School Fund to each school district that sponsors a charter school based upon that school’s enrollment.
Oregon law provides that a sponsoring district must pass on to its charter school at least 80 percent of its per-pupil grant for K-8 students and 95 percent of its per pupil grant for grade 9-12 students.
While the rest of Oregon school districts sponsoring virtual charter schools sponsor only one, the Mitchell School District is taking full advantage of the funding model, sponsoring three virtual public charter schools with total enrollment of 1054 students in 2022-2023:
Each of the virtual charter schools sponsored by the Mitchell School District contracts for the use of technology and curriculum from K12, a profit-driven Stride Company (NYSE: LRN).
I asked Melissa Hausmann, Head of School at all three schools, for copies of their contracts with K12 to get a better understanding of payments made by the charter schools to K12. Although Oregon Public Records law requires that a public body acknowledge receipt of a public records request within 5 business days of receipt, Hausmann has not responded to repeated requests for the contracts..
Given the voluminous data maintained by the Oregon Department of Education (ODOE), I assumed securing information on the state money going to the Mitchell School District because of its sponsorship of the three virtual charter schools would be a simple request. Accordingly, I asked ODOE:
How much money did the State School Fund distribute to the Mitchell School District for the 2022-2023 school year for each of the three virtual public charter schools the district sponsors?
School district sponsors are allowed to keep a portion of per-pupil funding provided by the state, usually 20% for K-8 schools and 5% for high schools. The rest goes to the charter school. I asked what percentage, and how many dollars, of per pupil funding provided by the state to each of these three schools was retained by the Mitchell School District in the 2022-2023 school year?
Surprisingly, ODOE said it was not the custodian of records that contained the specific information I requested. It suggested I contact the school district directly.
The Oregon Department of Education says it doesn’t know how much it is spending in support of virtual charter schools.
Mitchell School District Superintendent Vincent Swagerty acknowledged that the district had some of the records requested, but said it would cost $800 “to summarize, compile, review and forward these records.”
Oregon’s public records law allows for “reasonably calculated” fees to be imposed for responding to a public records request, but I considered an $800 fee exorbitant, prohibitive and even silly. Was the district really not able to quickly and easily find out. how much money it’s getting from the state in connection with its sponsorship of three virtual charter schools?
So I pursued an alternative, calculating estimated state payments using ODOE guidance on available data posted online by the department. A review of the Mitchell School District’s contracts with the three virtual charter schools then revealed the percentages of state school fund money passed on to the virtual charter schools.
Those calculations led to a rough estimate that the Mitchell School District retained the astonishing amount of approximately $727,000 of the state school fund money it received because of its sponsorship of the three virtual charter schools in the 2020-2021 school year.
The estimated total broke down as follows:
INSIGHT SCHOOL OF OREGON – PAINTED HILLS
The state sent an estimated $3,777,660 to the Mitchell School District. An estimated $130,656 (20% of the state’s money for students in grades 7-8) and $156,773 (5% of the state’s money for students in grades 9-12) was retained by the Mitchell School District. The remaining $3,392,445 went to Insight.
CASCADE VIRTUAL ACADEMY
The state sent an estimated $7,622,080 to the Mitchell School District. An estimated $357,764 (5% of the state’s money) was retained by the Mitchell School District. The remaining $6,797,516 (95% of the state’s money) went to Cascade.
DESTINATIONS CAREER ACADEMYOF OREGON
The state sent an estimated $1,681,164 to the Mitchell School District. An estimated $84,058 (5% of the state’s money) was retained by the Mitchell School District. The remaining $1,597,105 (95% of the state’s money) went to Destinations.
Estimate of $ retained by the Mitchell School District in 2020-2021
From Insight contract: $287,429
From Cascade contract: $357,764
From Destinations contract: $84,058
TOTAL: $729,251
Does the Mitchell School District agree with these numbers?
I asked Superintendent Swagerty. He responded that he had accepted a position in a new school district and referred me to two officials from the Mitchell School District. Neither responded to my follow-up inquiry spelling out estimated payments retained by the Mitchell School District in the 2020-2021 school year..
Whether or not my calculations are on the money, is the Mitchell School District using Oregon’s charter schools law as a cash cow to generate revenue for minimal effort?
Are the estimated 2020-2021 revenue numbers typical of annual payments retained by the Mitchell School District?
Does this put conservatives who oppose reckless government spending, but support school choice, in a quandary?
Are the district, the virtual charter schools and K12 in a parasitic relationship, each feeding off the other and Oregon taxpayers?
Is the funneling of so many taxpayer dollars to public school districts sponsoring virtual charter schools what the legislature intended with the charter school law?
For that matter, is it acceptable that the Oregon Department of Education, which dispenses millions of taxpayer dollars to school districts sponsoring virtual public charter schools, can’t, or won’t, tell the public precisely how much money it is sending to the sponsoring districts, how much those districts are keeping for themselves and how much they are sending on to the charter schools? Is that responsible governance?
The time has come for oversight that ensures public money is meeting its public purpose.
And then, of course, there’s the question of whether the taxpayer-supported virtual public charter schools are a public good in any case.
A June 2023 analysis from the US Census Bureau linked statewide education records from Oregon with earnings information from IRS records housed at the U.S. Census Bureau to provide evidence on how virtual charter students fare as young adults. “Virtual charter students have substantially worse high school graduation rates, college enrollment rates, bachelor’s degree attainment, employment rates, and earnings than students in traditional public schools,” the study concluded. “Although there is growing demand for virtual charter schools, our results suggest that students who enroll in virtual charters may face negative long-term consequences.”
BACKGROUND
Insight School of Oregon
Insight opened its doors in Oregon in 2012 as Insight School of Oregon Charter Option sponsored by the Crook County School District in Central Oregon. To operate the school, its board contracted with K12, Virtual Schools LLC, a wholly owned subsidiary of publicly traded for-profit K12 Inc. (LRN:NYSE] ). Insight’s Oregon headquarters was located in a nondescript one-story office building at 603 NW. 3rd St. in Prineville.
In its first three years, Insight’s K-12 enrollment grew to more than 500 students from around the state.
But all was not well.
K12 Inc. argued that. its education program was “proven effective,” but the numbers told a different story to the Crook County School District. Even though the district netted $231,592 in the first year of its contract with Insight and $436,554 in the second, it began to have serious reservations about continuing the relationship.
In Nov. 2014, the Crook County School District sent a blistering letter to Insight expressing grave concerns about the school’s operations and academic performance. School Superintendent Dr. Duane Yecha and school board Chair Doug Smith told the school they had major concerns about Insight’s: inadequate tracking of student attendance and enrollment; academic achievement; poor test participation; low four-year graduation rate (16.18 percent in 2013-2014); and failure to meet financial requirements stipulated in the district’s contract with Insight.
“…these issues have given the district reason to consider whether Insight is able to meet its ongoing obligations under the Charter Agreement and under ORS Chapter 338,” the letter said.
In 2015, even though the district was set to net $480,710 from its sponsorship of Insight in the 2014 – 2015 school year, it decided not to renew the sponsorship.
So Insight went shopping.
It quickly found a new partner, signing a sponsorship contract with the Mitchell School District 55 on April 29, 2015. The district had just one school serving a few local kids, some teens from around Oregon and a few international high students from Germany, Thailand, and Hong Kong. The international and regional students all lived in a school dormitory at the school.
With a new sponsor in hand, Insight changed to a grade 7-12 school and renamed itself Insight School of Oregon – Painted Hills.
Another change was the financial arrangements. Under its contract with the Crook County School District, Insight had agreed to the district keeping 5 percent of the State School Fund money it received for Insight students in grades 9-12 and 20 percent of what it received for kindergarten-8 students. Under the new contract with the Mitchell School District, the district agreed to keep just 10 percent of the total State School Fund money.
Destinations Career Academy of Oregon
Destinations Career Academy of Oregon, a full-time online public charter school authorized by the Mitchell School District, began its inaugural school year on September 4, 2018. It initially served students in grades 9-11, expanding to offer 12th grade for the 2019-20 academic year.
As part of the Oregon public school system, Destinations Career Academy is tuition-free, providing parents and families the choice to access the curriculum provided by K12 Inc. (NYSE: LRN) a provider of K-12 proprietary curriculum and online education programs.
Cascade Virtual Academy
Cascade Virtual Academy, a full-time online public charter school, began its inaugural school year sponsored by the Mitchell School District on September 4, 2018, offering a tuition-free to option students statewide in kindergarten through eighth grade.
Confusingly, there is also a Cascade Virtual Academy based in Aumsville, Oregon that provides a comprehensive online education for students in grades six through 12 who live within Cascade School District #5. The district , which operates six schools, serves approximately 2,500 students living in Aumsville, Turner, and Marion, Oregon.
















 ThinkingOregon