California Democrats are worried: Counting illegal immigrants

immigrantsWall

California could lose a seat in the House of Representatives and some Congressional districts could lose population if the millions of illegal immigrants living in the state, which has the largest number of illegal immigrants by far, aren’t counted in the 2020 census.

Oddly enough, California could improve its chances of holding onto that seat if more illegal immigrants come to the state and are counted in the census. Maybe that plays a part in California’s decision to be a Sanctuary State.

The U.S. Census Bureau attempts to count all persons in the U.S. living in residential structures, including prisons, dormitories and similar “group quarters” in the official decennial census. People counted must include citizens, legal immigrants, non-citizen long-term visitors and illegal (or undocumented) immigrants.

This approach was endorsed by the U.S. Supreme Court in April 2016 in EVENWEL ET AL. v. ABBOTT, GOVERNOR OF TEXAS, ET AL, where the Court rejected counting just eligible voters in determining legislative districts.

Efforts in Congress to change this approach have failed to date.

Accordingly, a low number of illegal immigrants counted by the Census in one state may result in that state losing some representation in Congress while high illegal immigration into another state that is counted in the Census can enlarge that state’s representation.

A research report by Election Data Services released Dec. 26, 2017, concluded, “…California is very close to actually losing a congressional seat in 2020, the first time that state will have lost a seat in its nearly 160-year history.” It could lose the seat because “for the last several decades California’s population growth has been relatively flat when compared to other states.”

That makes it even more important to Democrats that everybody is counted. Democrats are worried that if foreign immigration into California slows under Trump, and legal and illegal immigrants don’t step up in the 2020 census, that could hold down the state’s total population count and the count in individual Congressional districts.

Oregon could gain a seat

The Election Data Services report also concluded that, based on new Census Bureau population estimates for 2017 released on Dec. 26, 2017, 12 states clearly will be affected by changes in their congressional delegation if the new numbers were used for apportionment today.

New York, West Virginia, Illinois, Michigan, Minnesota and Pennsylvania are projected to lose a seat in Congress using the new data.

On the other hand, Oregon is projected to gain a House seat, as well as Colorado, Florida and North Carolina. Texas will gain two seats based on the new data.

Since 1941, by law the number of seats in the U.S. House of Representatives has been capped at 435, so if a given state gains a House seat then another state must lose one.


NOTE: For more discussion on counting illegal immigrants in the U.S. Census, see Constitutionality of Excluding Aliens from the Census for Apportionment and Redistricting Purposes, Congressional Research Service Report.


Slavery in Connecticut: facing buried truths

  In Connecticut and elsewhere in New England, “All the best families owned ‘captives’.”               – Anne Farrow, “The Logbooks: Connecticut’s Slave Ships and Human Memory” (Wesleyan University Press).

hartfordslavead

A Hartford (CT) Courant notice of 24 May, 1773, concerning the availability for sale of a 28-year old mother and her two sons.


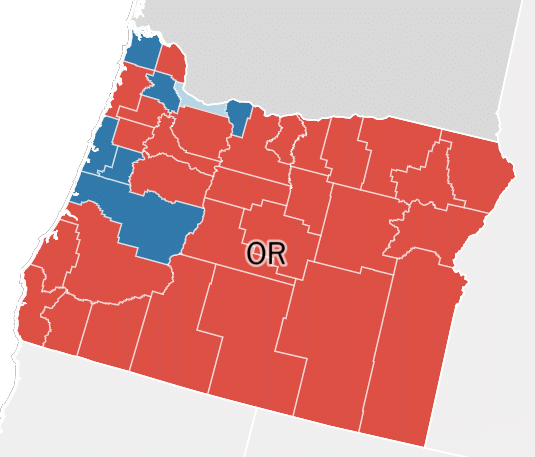
As Oregon, where I now live, has been coming to terms with its racist past*, I’ve found myself wondering whether Connecticut, where I grew up before moving to Oregon in 1984, shared some of that history.

Ahh, colonial Connecticut. Hardy Yankee farmers, white clapboard churches with tall tapering steeples, networks of grey stone walls, one-room schoolhouses….

newEnglandTown

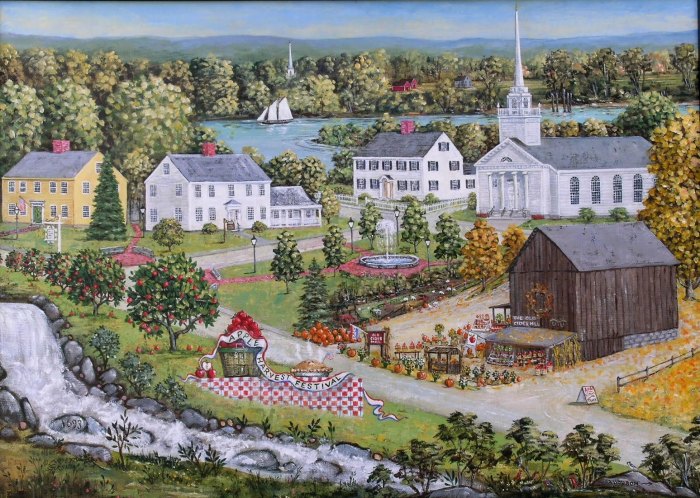
Ye olde Connecticut village

…and slaves.

Before the Civil War, nearly 4 million black slaves toiled in the American South. That’s the story we all learned in school, that slavery, with all its brutality, abuse and inhumanity, meant the South, just as many of us were mistakenly told that slavery was a uniquely American institution.

slaveAuctionPost

That’s what I was told when I grew up in the Connecticut town of Wallingford, settled in 1670, 50 years after the Mayflower’s 102 pilgrims landed at Plymouth.

I’m a descendent of one of the town’s original settlers, Samuel Hall, and of one of its most famous residents, Lyman Hall, a signer of the Declaration of Independence who was born and raised in Wallingford. So you’d think I’d be well versed in Connecticut’s history.

But I wasn’t told during my schooling that in the ancient world, slaves were common. Even in 5000 B.C., Uruk, considered the first city (in what is now called Iraq) had slavery. Most of the slaves then were captured in war, convicted criminals, or people heavily in debt.

As Kay Hymowitz, a Fellow at the Manhattan Institute has pointed out, slavery was a mundane reality in most human civilizations, appearing in the earliest settlements of Sumer, Babylonia, China, and Egypt, and it continues in some parts of the world to this day.

In North America, slavery was also endemic among Indian tribes before Europeans arrived. Andrés Reséndez describes in The Other Slavery: The Uncovered Story of Indian Enslavement in America (2016), the economy of the Comanche empire, based in central Texas, was based on human predation and the slave trade; the Comanches sold captured Indians, Mexicans, New Mexicans, and other Americans to any willing buyer.

I also wasn’t taught about all that, although the underground railroad helped escaping southern slaves in Connecticut, slavery flourished there at the same time.

According to the Medford, MA Historical Society,  Connecticut, Massachusetts, and Rhode Island were the three New England states with the largest slave population during the colonial period. Rhode Island had the largest proportion of slaves. It is likely that by the mid 1700’s, there were as many as one African for every four white families in these three states.

Connecticut, Massachusetts, and Rhode Island were the three New England states with the largest slave population. Rhode Island had the largest proportion of slaves. It is likely that by the mid 1700’s, there were as many as one African for every four white families in these three states.

In other words, colonial Connecticut was hardly a citadel of racially progressive thought and practice. For many Africans, it was a citadel of broken dreams.

It was a place of broken dreams for many Native Americans as well.

History of Slavery in Connecticut, published in 1863, pointed out that the earliest slavery in Connecticut wasn’t of blacks from Africa, but Native Americans captured in battle and sold as slaves. I don’t recall that being highlighted in my classes either.

In fact, the Articles of Confederation of the United New England Colonies, signed by representatives of the Plymouth, Massachusetts, Connecticut, and New Haven colonies, even stipulated that the signatories would equally distribute any “ persons,” lands, and goods “ taken as the spoils of war.”

King Philips War, during 1675 to 1676, which pitted Native American leader King Philip, also known as Metacom, and his allies against the English colonial settlers, produced a large number of native slaves.

In 1637, Connecticut colonial leaders, together with their Narragansett native allies, massacred the largest Pequot village at Misistuck on the Mystic River in present-day Connecticut, destroying it and killing an estimated 700 Pequots, including many women and children. Another 180 Pequots were killed when they were found hiding in a swamp near today’s Fairfield, CT. Many of the Pequots were captured and sold as slaves, leading to the near annihilation of the tribe.
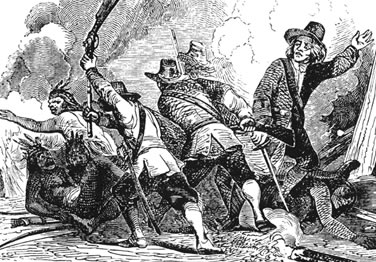
pequotwar

The Pequot War

A fascinating study by Linford D. Fisher, associate professor of history at Brown University, finds that Native Americans, including noncombatants, who surrendered during King Philip’s War to avoid enslavement were enslaved at nearly the same rate as captured combatants.

Fisher’s study, “‘Why shall wee have peace to bee made slaves’: Indian Surrenderers during and after King Philip’s War,” appears in the journal Ethnohistory, a volume devoted to scholarship on indigenous slavery in the New World.

Native American slavery “is a piece of the history of slavery that has been glossed over,” Fisher said. “Between 1492 and 1880, between 2 and 5.5 million Native Americans were enslaved in the Americas in addition to 12.5 million African slaves.”

While natives had been forced into slavery and servitude as early as 1636, it was not until King Philip’s War that natives were enslaved in large numbers, Fisher wrote in the study. The 1675 to 1676 war pitted Native American leader King Philip, also known as Metacom, and his allies against the English colonial settlers.

During the war, New England colonies not only retained many defeated native Americans as slaves, they  routinely shipped Native Americans as slaves to Barbados, Bermuda, Jamaica, the Azores, Spain and Tangier in North Africa, Fisher said.

“The shadow of native enslavement in New England extends into the 18th century and beyond,” Fisher said. “There are records of people petitioning for freedom in the 1740s who were the descendants of Native Americans first enslaved during King Philip’s War.”

Black slaves were also very much a part of early New England. “Slaves were widely viewed as an economic necessity in colonial New England,” according to the Florence Griswold Museum in Old Lyme Connecticut. The Museum cites a letter to John Winthrop (1588–1649), governor of the Massachusetts Bay Colony, from his brother-in-law Emmanuel Downing (1594–1676) advised in 1645: “I doe not see how wee can thrive untill we get into a stock of slaves suffitient to doe all our buisines.”

“As the town (Old Lyme) grew and prospered, governors, judges, military officers, ministers, deacons, doctors, merchants, mill owners, tavern keepers, and well-to-do farmers all owned slaves,” according to the Museum. ” Sea captains, shipyard owners, ship’s joiners, deckhands, coopers, blacksmiths, carpenters, mill workers, farmhands, shad fishermen, and day laborers benefited, in turn, from Lyme’s coastal trade.”

Rhode Island was one of New England’s states particularly active in slavery.

“Newport (R.I) was the first landing place for most of those people…who set foot on Jamestown (R.I) in bondage,” wrote historian James Fay of the Jamestown Historical Society.  “They arrived here from across the bay in Newport, the center of the American-owned slave trade, the port where 965 Rhode Island ships carried people of Africa to the British West Indies and southern American ports, Barbados, Jamaica, Antigua, the ports of Savanah and Charleston, and occasionally, to Newport. These Rhode Island ships, though only a tiny part of the Atlantic slave trade, carried 106,000 people to the Americas. These people were purchased by Rhode Island captains from African traders who had captured and enslaved them in wars and raids upon each other to enrich themselves at the expense of their enemies, and to feed the insatiable demand by Europeans for slaves.”

Even the Newport Town Council got into the slave business. Fay wrote of how the entire Martin family of Jamestown – the mother Peggy and her five children Newport, Peggy, Jude, Jacob, and Jamestown; the men Mintus and Abraham Martin –were sold to new owners or indentured to free the town of the debts of their owner, Rebecca Carr Martin.

It’s also worth knowing that the slaves who ended up in New England were a very small proportion of Blacks brought across the Atlantic from Africa.

Most of the Blacks taken from Africa were sold to enslavers in South America or the Caribbean. British, Dutch, French, Spanish and Portuguese traders brought their captives to, among other places, modern-day Jamaica, Barbados, Cuba, Puerto Rico, Brazil and Haiti, as well as Argentina, Antigua and the Bahamas, according to an exhaustive SlaveVoyages database considered in depth in a New York Times story, Quantifying the Pain of Slavery.

Only slightly more than 3.5 percent of the total, about 389,000 people, arrived on the shores of British North America and the Gulf Coast during those centuries when slave ships could find port.

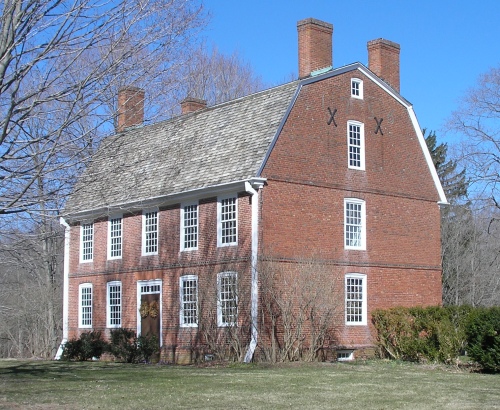
Some of those found themselves owned by Theophilus Jones (1690-1781), who came to Wallingford in 1711. He built up his farm property and c. 1740 built a house on Cook Hill in the southwest corner of town, now 40 Jones Rd. His son, Theophilis Jones, Jr. (1723-1815) a documented slave owner, continued to amass land at the site.

The house, which is still standing, is now on the National Register of Historic Places.

OLYMPUS DIGITAL CAMERA

Theophilus Jones house, Wallingford, CT

Another slave-owner’s house still standing in Wallingford is the John Barker House, built in 1756.

OLYMPUS DIGITAL CAMERA

John Barker house, Wallingford, CT

Slaves were brought into New England throughout the colonial period through multiple port cities:

  • Portsmouth, NH
  • Salem, MA
  • Boston, MA
  • New Bedford, MA
  • Providence, RI
  • Bristol, RI
  • Newport, RI
  • Middletown, CT
  • New London, CT

Connecticut, Massachusetts, and Rhode Island ended up having the largest slave populations, though they were far from alone among northern states in accepting slavery.

Slavery continued to exist in New York, without any protest against it, until the Quakers took action in the 1760s to free the slaves held by their members, according to a 1925 History of Westchester County,  New York by Alvah P. French.

In 1767, Purchase Quarterly Meeting sent the following minute to the Yearly Meeting, then held at Flushing: ” If it is not consistent with Christianity to buy and sell our fellowmen for slaves, during their lives and their posterity after them, then whether it is consistent with a Christian spirit to keep those in slavery that we have already in our possession by purchase, gift or any other ways.” The subject was continually before their meetings until the last slave held by a Friend was set free, in 1779.

Others followed the example set by the Quakers in freeing their slaves, so that, by the end of the century, but few slaves remained in the county. All slaves in the State of New York were made free by law on 4th of July, 1827.

When the Quakers of Purchase liberated their slaves they settled them on their rough lands in the northwestern portion of the town of Harrison, and thus the negro community, still existing northeast of the village of White Plains, was begun. Some of the slaves liberated in the northern portion of the county collected into a smaller settlement near the village of Bedford. These were the largest colonies of negroes in the county.

If you’ve ever visited the historic Faneuil Hall Marketplace in Boston, MA, you may be surprised to learn that Peter Faneuil, who donated the site to the city, accumulated much of his substantial wealth from the slave trade.

faneuilHall

Faneuil Hall, Boston

Slaves were also in evidence at tobacco farms in the Connecticut River Valley as early as  the seventeenth century.  Tobacco was introduced when seeds were brought from Virginia in 1640.

Tobacco production was significant enough that the Connecticut Town of Windsor  found it necessary to appoint an “Inspector and Presser of Tobacco,” to supervise the grading and packing of tobacco in hogsheads for shipment to the West Indies, South America, and Europe. According to an overview of the Windsor Farms Historic District, Black slaves and semi-indentured Indians provided most of the labor on the larger farms.

Archaeologists from Central Connecticut State University came across what looked like a 13,000-acre plantation, the second largest in southern New England, in Salem, CT. According to the Hartford Courant  newspaper, the owners may have imported 60 slave families to clear the land and relied on slave labor to operate the plantation.

At the start of the Revolutionary War, when the Salem plantation was confiscated because the owner was a Tory, it had just nine slaves (Great Prince, Little Prince, Luke, a woman named Prue and children named Cato, Phillis, Rose, Jimm and Caesar) . The adults were valued at 200-450 pounds each, 6-month-old Jimm and 11-year-old Caesar at 10 pounds.

A smaller plantation  of 3,000 acres with at least two dozen slaves also existed in Pomfret, CT, the Courant reported. When the owner transferred ownership of the estate in 1764, the deed included an inventory that included 27 negroes. The document identified the slaves by the names “Prince, Harry, Pero, Dick, Tom, Adam and Christopher, all Negro men, and Dinah, Venus, Rose, Miriam, Jenny and [a second] Rose, all Negro women… ” along with their children “Primus, Christopher, Sias [sic], Sharper and Little Pero.”

Similarly, John Easton’s family in Middletown, CT were leading slave merchants.

In “The Logbooks: Connecticut’s Slave Ships and Human Memory,” Anne Farrow wrote about the ship Africa, with John Easton as its captain, sailing out of New London, CT in 1757 bound for West Africa. It crossed the Atlantic Ocean, sailed up the Sierra Leone River on the west side of the continent, docked at tiny Bunce Island and loaded a cargo of slaves to be sold principally on England’s colonial islands in the Caribbean. Some of the “human cargo” probably stayed on board to be brought to Connecticut, where they were sold and owned by residents there, Farrow said.

According to the Hartford Courant, when John Easton died in 1774 his will contained 20-page inventory of his property, which included two Negro men, Accrow, valued at 100 pounds, and Gambo, valued at 25 pounds.

That same year, The Connecticut Journal reported that John Ive’s slave, Lemon, was “taken to the Gaol in New Haven for abusing an Indian girl” and was sentenced to “sit on the Gallows with a rope about his neck one hour and then whips 39 stripes at a Cart’s Tail.” There was also an incident in which a man named Phineas Cook brought a Portuguese man to Connecticut and sold him as a slave. The matter went before Connecticut’s General Assembly which fined Cook and ordered him to return the man to the Cape Verde archipelago off the west coast of Africa.

By the way, it was in the following year, 1775, that the Rev. Samuel Andrews, a committed Tory, is reported to have preached the first sermon against slavery in Wallingford’s Episcopal Church.

Slaves were also mentioned in the list of items Dr. William Hart of Wallingford left to his wife upon his death in Oct. 1799. The items included “…an inkstand, three iron pots, one spider, a Negro boy named Titan, and a Negro girl of five years.”

Some Wallingford residents began freeing their slaves, however, after the Declaration of Independence, spurred on by a law enacted by Connecticut’s General Assembly in 1777 stating that if “any slaveholder shall apply  to the selectmen for liberty to emancipate his slaves, it shall be the duty of the selectmen to enquire as to the ability of such slave to support himself, and if found capable, give the slaveholder a certificate of liberty to free the negro.”

According to town records, 17 slaves were given their freedom by residents from 1778 to 1786 by the following local residents: Ruth Merriam; Rachel Johnson; John Hough; Gould; Norton; Martha Doolittle; Miles Johnson; John Barker; Dr. Jared Potter; Samuel Street; Elisha Brockett; Turhand Kirtland; Edward Barker; Abner Rice; and Thomas Hall.

One of the few first-hand written accounts of an African being enslaved and shipped to the New World is Venture Smith’s A Narrative of the Life and Adventures of Venture, a Native of Africa: But Resident above Sixty Years in the United States of America. Related by Himself, published in New London, CT in 1798.

VentureSmithBook.jpg

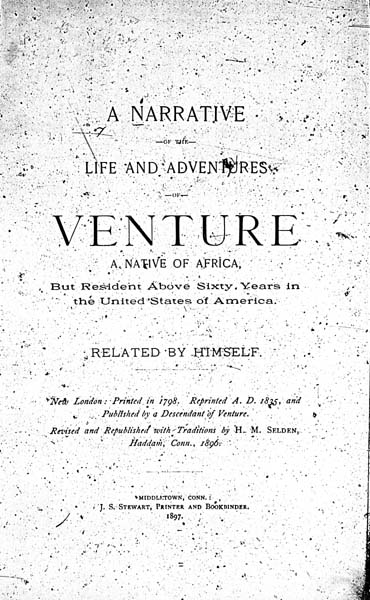
Smith (His African name had been Broteer, 8-year-old son of Saungm Furro, Prince of the Tribe of Dukandarra in Guinea) was taken captive in West Africa around 1730 and taken to the coastal slave-trading center Anomabo (in present-day Ghana) for sale. Broteer later recalled that an officer on a Rhode Island slave ship purchased him for “four gallons of rum and piece of calico cloth.”  Most of the captives were later sold in Barbados, but Smith went on to Newport, RI and spent the next three decades as a slave in New York and Connecticut.

Venture Smith died in 1805. He was buried in the graveyard of the First Congregational Church in East Haddam, CT, along with his wife, Meg, and other members of their family. Smith’s gravestone can be seen there to this day.

VentureSmithHeadstone-e1338404476114

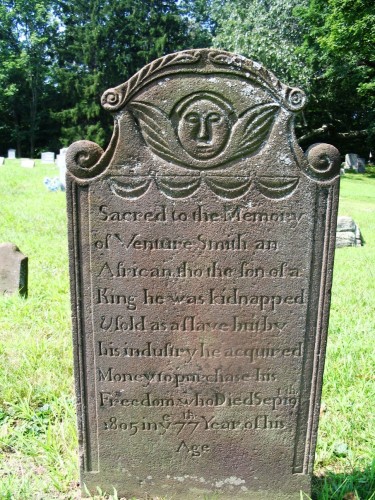
“Sacred to the memory of Venture Smith, an African. Tho the son of a King he was kidnapped and sold as a slave but by his industry he acquired Money to Purchase his Freedom.” Venture Smith gravestone.

William Grimes, who arrived just after 1800, was among the first runaway slaves from the South to reach Connecticut and New Haven. Grimes later published “Life of William Grimes, the Runaway Slave,”an autobiographical account of slavery in the South and the treatment of African Americans in the North during his lifetime.

LifeofWilliamGrimes

In Sept. 2018, he was inducted to the Connecticut Freedom Trail location at New Haven’s Grove Street Cemetery , where he is buried, for his pioneering contribution to U.S. history. Grimes’ great-great-great-granddaughter, Regina Mason, was a speaker at the event.

In 1811, George Washington Stanley Esq. , the son of Wallingford resident Oliver Stanley, wrote a brief manuscript history of Wallingford for the Connecticut Academy of Arts and Sciences  and sent it to Prof. Silliman of Yale. The report noted that of  Wallingford’s 2,325 inhabitants, there were  “1,152 white males,1,147 white females, 22 of color and four slaves, also ten foreigners, natives of England and Ireland.”

For nearly two hundred years New England maintained a slave regime that some historians used to claim was quite different from in the South.

Instead of slaves performing mainly agricultural labor, as in the South, the Medford (MA) Historical Society and Museum says New England’s slaves performed more varied jobs. “Owned mostly by ministers, doctors, and the merchant elite, enslaved men and women in the North often performed household duties in addition to skilled jobs,” the Society says. “They worked as carpenters, shipwrights, sailmakers, printers, tailors, shoemakers, coopers, blacksmiths, bakers, weavers, and goldsmiths. Many became so talented in the crafts that the free white workers lost jobs to them.”

But the idea that New England slaves were not situated on large agricultural properties has been refuted by other historians.

A 1764 inventory of “living creatures” on a 3000 acre plantation in Pomfret, CT listed 80 cows, 45 oxen, 30 steers, 59 young cattle, six horses, 600 sheep, 180 goats, 150 hogs and 27 Negroes, in that order.

farm_slaves

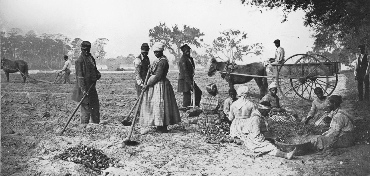
Slaves working on a New England farm

And in 2015, Central Connecticut State University archeologists uncovered in Salem, CT the remnants of a large plantation that was worked by as many as 60 slave families in the years before the American Revolution.

According to research by the Hartford Courant, the creation of that plantation began in 1718 when Col. Samuel Browne, a wealthy Salem, MA merchant, began amassing land. He rented out some tracts, retaining about 4,000 acres for himself. That passed to his son and then to his grandson.

In 1690 there were only an estimated 200 black slaves in Connecticut; by 1774, that had grown to 5,100.

“The effects of the New England slave trade were momentous,” wrote Lorenzo Johnston Greene in The Negro in Colonial New England, 1620-1776. “It was one of the foundations of New England’s economic structure; it created a wealthy class of slave-trading merchants…”

Harvard Professor Bernard Bailyn, in an essay on how New Englanders had achieved such a high standard of living by the time of the revolution, wrote, “The most important underlying fact in this whole story, the key dynamic force, unlikely as it may seem, was slavery.”

That was only about 3.4 percent of the state’s population, “But it was slavery, nevertheless, that made the commercial economy of 18th-century New England possible and drove it forward,” Bailyn wrote. “The dynamic element in the region’s economy was the profits from the Atlantic trade, and they rested almost entirely, directly or indirectly, on the flow of New England’s products to the slave plantations and the sugar and tobacco industries they serviced.”

As the Black slave population increased, Connecticut’s lawmakers enacted more and more laws to control it, according to David L. Parsons of the Yale-New Haven Teachers Institute.

The so-called Black Code, a series of laws passed between 1690 and 1730, described the rights and responsibilities of slave and master.

The Black Code formalized slavery in Connecticut. There were no laws specifically forbidding slavery, and custom and the laws controlling it combined to give slavery legal standing in Connecticut, according to Parsons. The early Capital Law of 1642, which prohibited stealing “man or mankind” was interpreted to mean only white mankind.

Parsons wrote of how black servants were required to carry passes outside of town or be treated as runaways. Sellers of liquor were not allowed to serve Blacks without permission from their master. It is not clear what was done to Blacks who drank without permission. Blacks were not allowed to sell items without proof of ownership or written permission from the owner. Blacks were liable to whippings for disturbing the peace or “offering to strike a white person.” Blacks found outside after 9:00 p.m. without a pass could be whipped. Whipping was also the punishment for slaves who used unseemly language.

In 1769, a man named Bishop built the Oakdale Tavern in Wallingford to serve travelers between Boston and New York. “On the hillside in the rear of of the tavern were several cabins where slaves employed on the place dwelt,” wrote a local historian, Bill Stevens. (Source: “Bill Stevens Relates,” Meriden Record, April 8, 1954) 

As late as 1774, the Connecticut Journal justified the subordinate status of blacks, stating baldly that “God formed [blacks] … in common with horses, oxygen, dogs etc. for the white people alone, to be used by them either for pleasure or to labor with other beasts.”

That same year the April edition of The Connecticut Journal reported that a slave, Lemon, was “taken to the gaol in New Haven for abusing an Indian girl.” (Source: Clipping, “Tales of Other Days,” by Lavinia, Meriden  Record, undated)

On the eve of the American Revolution, Connecticut had 6,464 slaves, the most of any state in New England, according to one historian. The number of whites in the state that same year was 191,372, the state’s governor reported.

Some of those slaves tried to run away, generating advertisements in local papers seeking their return. Two 1761 ads specifically referred to runaway slaves from Wallingford:

Newspaper  Connecticut Gazette

Date  December 5, 1761

Author(s)  David Cook 

Runaway(s)  Jack 

Location  Wallingford, CT

Language Skills  speaks english well

Reward  5 dollars 

Transcription

RUN away from the subscriber in Wallingford, on the 28th of November. A negro man-servant named Jack at middling stature is marked with the Small-pox, speaks good english, had on when he ran away, a red duffel coat, a blue jacket without sleeves, leather breeches, and an old frock. He has some scars from the whip on his back, whoever should take up said negro, and return him back to his said master or secure him in any of his majesty’s gaols, shall have five dollars reward, and all necessary charges paid by me David Cook jun. Whoever shall apprehend said Runaway, are desired to secure him in Irons.

Newspaper New-London Summary

Date June 26, 1761

Author(s) David CookeCharles Whittlesey

Runaway(s) TonyTully

Location  Wallingford, CT

Language Skills  Both good english

Reward  40 shillings

Transcription

RANAWAY on the 10th of June, (at Night) from David Cooke of Wallingford, a Molatto Man servant, named TONY, about 26 Years old, middling statute, speaks good English, one sore leg, and is bigger than the other. He had on when he went away a light coloured broad cloth coat, light camblet jacket tow shirt and trowsers. Also, RUN-AWAY the same Night from Charles Whittlesey, Eso; of Wallingford aforesaid. A Molatto Man servant, named TULLY, about 28 years old, speaks good English, about 6 feet high, he has long hair. He had on a dark broad cloth coat, tow shirt and trowsers. Whoever shall take one or both of the above servants, are desired to secure them in irons, and give Notice to their said masters, for which they shall have Forty Shillings reward for each and all necessary charges paid by David Cooke, Charles Whittlesey.

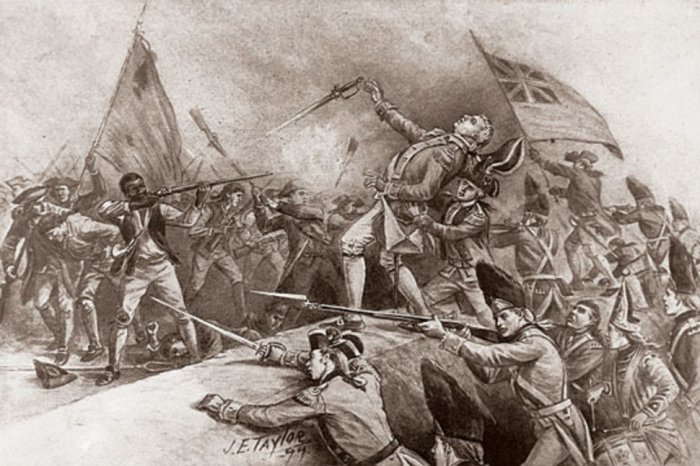
During the American Revolution (1765 – 1783), when at least 820 free and enslaved African Americans from Connecticut served on the Patriots side, some Connecticut slaves gained their freedom in exchange for service (The National Mall Liberty Fund  has collected a list of Enslaved and free blacks from Wallingford, CT who served on the patriot side during the Revolutionary War.).

blacksduringrevolution

Other slaves purchased their freedom. Wallingford’s archives include an April 2, 1776 note about a local man, Mr. Elisha Brackett, freeing his “Negro Wench Slave named Nancy” in return for her paying him “32 Pounds Lawful money.”

Connecticut’s Gradual Emancipation Act of 1784 halted the importation of slaves and declared that children of black slaves born after March 1, 1784 were to be freed after turning 25. No current slaves were freed by the Act, however, and slaves born before 1784 remained slaves for life.

Not only that, but the act had a pernicious effect in that it encouraged some slaveholders to sell slaves and their children to residents of other states before the children reached 25, an action not prohibited by the law, where they would again be slaves for life.

JamesMars2-e1338408753130JamesMarsMemoir

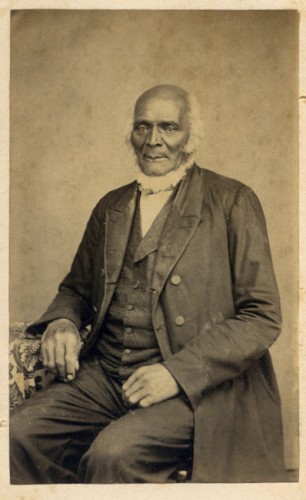
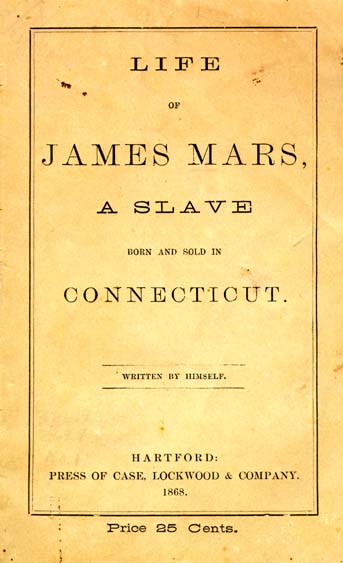
One man affected by the Gradual Emancipation Act was James Mars, a slave in Connecticut until age 25, who wrote a memoir published in several editions between 1864-1876. “When I had got it written, as it made more writing than I was willing to undertake to give each of them one, I thought I would have it printed, and perhaps I might sell enough to pay the expenses, as many of the people now on the stage of life do not know that slavery ever lived in Connecticut,” Mars wrote

Documenting the American South, a collection of American slave narratives, tells of how, with the help of white citizens of Norfolk, CT,  Mars evaded his owner’s attempts to take him to Virginia where he would have been denied the emancipation guaranteed him at age twenty-five under Connecticut law. Born in 1790, Mars lived until 1880.

Some historical writing on American history downplays the maintenance of slavery in Connecticut after the American Revolution and the Gradual Abolition Act.

In Hope of Liberty, James Oliver Horton and Lois E. Horton wrote, “ [m]any slaves were freed by the gradual emancipation laws in the North, and in a relatively short time (relative to the existence of the institution of slavery) slavery was abolished in the free states.”).  Similarly, in Black Odyssey: The African-American Ordeal in Slavery, Nathan Irvin  Huggins wrote, “…after the Revolutionary War] [t]hose states of New England, where there was a slight investment in slave property, were rather quick to disavow the institution.”

But other historians have challenged that view. In a 2001 Yale Law Journal article, Abolition Without Deliverance: The Law of Connecticut Slavery 1784-1848 , David Menschel presented evidence that the Gradual Abolition Act did not remove slavery from the state in a prompt and orderly fashion at all. Instead, he said, slavery’s termination was protracted because, “Legislators feared that uncivilized and uneducated blacks, emerging en masse from bondage into freedom, would endanger the fragile workings of Connecticut’s new republic.”

“In fact, though the number of slaves in the North declined after the Revolutionary War, slavery continued to exist there well into the nineteenth century,” Menschel said.

Even the State of Connecticut itself seemed to endorse continued slavery when, in 1784, it seized the estate of a William Brown, which included a number of slave children. An administrator of the estate petitioned the Legislature to free the children, but it rejected the petition and ordered that the children be bound out for the District of Norwich.

“In addition to protecting the state coffers from the costs of caring for such dependents, the Assembly also seems to have believed that Brown’s former slaves would benefit from bondage, as this would ensure that the slave children would be ‘well governed and educated,’ ” Menschel said.

In 1787, Oliver Ellsworth, a Connecticut delegate at the Constitutional Convention, predicted that “slavery in  time will not be a speck in our country,” but “in time” proved to be long-lived, with slavery not ending across the United States for another 78 years.

It wasn’t until 1788 that legislation outlawed the slave trade in Connecticut, prohibiting the import of Africans and the export of Africans for sale, but in 1794 the state legislature firmly rejected a bill that would have abolished slavery in the state the following year.

In 1790, the first Federal Census showed there were 3,763 people held in bondage throughout New England, including  2,648 in Connecticut. A 1797 act changed the emancipation age under the Gradual Abolition Act age to 21, but still didn’t abolish slavery.

Evidence of continued slavery in Connecticut showed up in Probate Court records of Wallingford, CT following the death of a Dr. William Hart. According to the records, among the items Hart left to his wife, Catherine Vallet Hart, were “a Negro boy named Titan and a Negro girl of five years.”  (Source: Clipping, “Tales of Other Days,” by Lavinia, Meriden  Record, undated)

By 1800, 83 percent of Connecticut’s Blacks were free, leaving 951 enslaved, but these were still being held onto vigorously, as the 1803 runaway slave ad below shows.

SlaveryRunAwayBroadside-e1338480755324

In the early 1800s, George Washington Stanley completed a census of Wallingford, CT at the request of Yale professor Benjamin Silliman. Stanley’s report said the village had 2,325 inhabitants, including “1,152 white males, 1,147 white females , 22 (people) of color and four slaves…” (Source: Clipping, “Tales of Other Days,” by Lavinia, Meriden  Record, Feb. 1953)  

In 1810, the number of slaves in Connecticut had gone down to 310 and by 1820 the census put the number at 97.

The 1840 Census showed 17 African-Americans still enslaved in Connecticut, but anti-slavery attitudes were prominent.

Even free blacks began to speak up. The words of one free black man, Peter Osborne, are preserved in “An oration delivered before the people of color of New Haven, assembled at Wallingford on the eighth of July, to celebrate the fourth.”

In vivid, forceful language, Osborne applauded the displays of patriotism on the 4th of July 1845, but castigated white Americans for not sharing the freedom the American Revolution produced.

“The heroes of the revolution were gallant and terrible to establish and secure a government for the peace and happiness of the descendants of Europe, but they were not the less so to deprive the descendants of Africa of its protection,” Osborne said. He called upon all blacks to “…like a Roman army, invade prejudice, storm the castle of expediency, — to annihilate the inhuman trade of transportation–the deluded scheme of Colonization,  the scourge and curse of slavery.”

Connecticut finally abolished slavery entirely in 1848, when there were just six slaves left in the state, making it the last state in New England to fully abolish slavery. The last slave in Wallingford was owned by J. Parker of Pond Hill, according to A History of Wallingford 1669-1935 and Wallingford 1669-1935, produced for Connecticut’s Tercentenary Celebration.

It’s not generally known that prior to that point, hundreds of slaves had been owned even by members of Congress from Connecticut.

From the founding of the United States until long after the Civil War, hundreds of the elected leaders writing the nation’s laws were current or former slaveowners.

More than 1,700 people who served in the U.S. Congress in the 18th, 19th and even 20th centuries , including 13 from Connecticut, owned human beings at some point in their lives, according to a Washington Post investigation of censuses and other historical records that revealed its findings in January 2022.

People looking today for records of slaves with a connection to Connecticut can turn to Enslaved.org The database, which gathers records about the lives of enslaved Africans and their descendants has been undergoing a crowdsource-powered expansion to unlock Black Americans’ genealogical histories. The general public and outside researchers can submit family histories, runaway slave ads, or documents of purchase to the site and users can search their names and town histories and connect the experiences of enslaved people, from voyages to the changing of names.

Jessica Ann Mitchell Aiwuyor, founder of the National Black Cultural Information Trust, said African Americans have long sought to reclaim their past. “Even after the Civil War, former enslaved people put ads in newspapers looking for lost family members,” she said. “This website is a continuation of that tradition as we look for our past and family but this time in a digital space.”

Even after Connecticut abolished slavery,  the New England states were far from welcoming to Black people. According to the Wall Street Journal, Lincoln’s Emancipation Proclamation of 1863 revived the long-held fears of many white Northerners that “hordes” of newly freed slaves would flood their cities in search of jobs and housing. Sooner or later, warned the New York Daily News, “we shall find negroes among us thicker than blackberries.”

And as late as 1976, slavery in Wallingford was still being depicted as a benevolent practice. From These Roots, A Bicentennial History of a New England Town, published in 1976, said slavery in Wallingford “was a benign form of ownership here mostly confirmed to household service.”  The history went on to say slavery in the town “never attained any importance and the slim records seem indeed often to picture a strong and affectionate relationship.”

We should know these things.

As Holocaust survivor and scholar Dr. Dori Laub has written, we must face our buried truths in order to live our lives.

Addendum – June 19, 2020: With increased interest in Juneteenth, some additional information may be of interest. Juneteenth is a day that commemorates the end of slavery in the United States, but on that day — June 19, 1865 — when Texas slaves were finally notified they were free, thousands of other Black Americans remained in bondage.

According to the Boston Globe, There were four Union border states — Delaware, Kentucky, Maryland, and Missouri — that did not secede. The Emancipation Proclamation freed slaves in Confederate states, but not in those four Union states.

Granted, most whites in those states did not own slaves, and slaves made up relatively small percentages of the population, from 1.6 percent in Delaware to 19.5 percent in Kentucky, according to encyclopedia.com. In contrast, slaves were 29 percent of the total population of the Upper South and 47.5 percent of the Deep South.

But percentages don’t matter: By 1860, there were 225,483 slaves in Kentucky, 114,931 in Missouri, 87,189 in Maryland, and 1,798 in Delaware.

Maryland abolished slavery in 1864, and Missouri followed in 1865. But many Black Americans in Kentucky and Delaware remained enslaved until the 13th Amendment was ratified in December of 1865 — six months after Juneteenth.

______________________________________________________________________________

  1. With so many years gone by since the 13th amendment was ratified in 1865, you might think that it has to  be impossible to hear a former slave talk about the experience.  But amazingly you still can by going to Voices from the Days of Slavery: Former Slaves tell their Stories – a collection on file at the Library of Congress and available online . Here individuals give firsthand accounts of life during slavery. Hearing the voices of those who were enslaved is more powerful than what could ever be captured in a textbook.

2.  Recommended readings about Oregon’s racist past:

Breaking Chains – Slavery on Trial in the Oregon Territory by R. Gregory Nokes

Tells the story of the only slavery case ever adjudicated in Oregon courts—Holmes v. Ford. Drawing on the court record of this landmark case, Nokes offers an intimate account of the relationship between a slave and his master from the slave’s point of view. He also explores the experiences of other slaves in early Oregon, examining attitudes toward race and revealing contradictions in the state’s history.

When Portland banned blacks: Oregon’s shameful history as an ‘all-white’ state, Washington Post, June 7, 2017

Few people are aware of Oregon’s history of blatant racism, including its refusal to ratify the 14th and 15th Amendments of the Constitution.

Oregon Racial Laws and Events, 1844-1959

Oregon’s Provisional Government passed the first Exclusion Law in the Oregon Country in 1848. It made it unlawful for any Negro or Mulatto (of mixed ethnic heritage) to reside in Oregon Territory.

Oregon’s Civil War – The Troubled Legacy of Emancipation in the Pacific Northwest by Stacey L. Smith

The persistent myth that Oregon was a free land where white unity against slavery made free-state status nearly inevitable often obscures the prominence of the slavery question in provisional, territorial, and state politics.

Will the sky fall for charities under the new tax law?

tax-form-gifts-to-charity_573x300

Charities and much of the media are screaming bloody murder about the potential negative impacts of the new 503-page tax reform legislation.

“The tax code is now poised to de-incentivize the heart of civic action in America,” Dan Cardinali, president of Independent Sector, which represents charities, told the Washington Post.

“The GOP tax reform will devastate charitable giving,” shrieked the Los Angeles Times.

Stacy Palmer, Editor of “The Chronicle of Philanthropy,” said on Public Television’s Newshour that as much as $20 billion might not be given in 2018 next year because of the tax law change. An Indiana university study estimated the reduction would be $13 billion.

This apocalyptic vision fits in nicely with the attempt by Democrats to demonize the tax reform law and the Republicans who voted for it in hopes of reaping benefits in the 2018 elections.

But is charitable giving really going to implode? I think not.

The primary concern among the nattering negative cadre appears to be that the number of Americans who qualify for the charitable tax deduction will drop sharply now that the standard deduction has been doubled to $12,000 for an individual, $24,000 for couples. This will result in fewer people itemizing their deductions, and you can only deduct donations if you itemize, a key factor motivating charitable giving, according to the doomsayers.

But this ignores the fact that an awful lot of people already give generously from the heart without claiming a charitable deduction. According to the most recent IRS data, 68.5 percent of households chose to take the standard deduction under the old system, leaving them unable to claim a charitable deduction, but a lot of them made donations anyway. In 2016, the largest source of charitable giving was individuals at $281.86 billion, with two thirds of households giving money to non-profits.

It is estimated that under the new tax law, the share of people itemizing deductions could drop to as few as 5 percent.

It seems highly unlikely that individuals who haven’t been itemizing or those who won’t itemize under the new tax system will decrease their charitable giving when the standard deduction is doubled. In other words, the vast middle class will still probably give, though charities may want to ramp up their appeals.

What looks considerably more threatening for charities is changes in the estate tax under tax reform.

gravedigger_observations2

Before the tax reform law, the estate tax applied only to estates worth at least $5.49 million for individuals and $10.98 million for married couples. The estate tax applied a 40 percent tax rate to estates worth more than those amounts.

In other words, the wealthy have been encouraged to make charitable donations because these donations were not taxed. If their money was left to heirs instead, the estate would pay taxes on amounts greater than about $5.5 million dollars for an individual or $11 million for a couple.

The new tax law tax doubles the annual exclusion amount (the exemption) for estate taxes to $10 million. Couples who do proper planning could double that exemption.

Only 0.2% of all estates ended up being hit with the estate tax under the old formula. The Tax Policy Center estimates that some 11,310 individuals dying in 2017 will leave estates large enough to require filing an estate tax return.

Under the new law, it’s likely that fewer than 1,000 estate tax returns will be filed per year with a tax due. In other words, just 10,000 individuals may be less likely to make charitable donations to avoid estate taxes.

But those individuals control a lot of wealth and many may be people who were previously motivated to give by a desire to avoid estate taxes.

According to the National Committee for Responsive philanthropy (NCRP), study after study shows that tax policy matters in charitable giving and that the estate tax is one of the most important motivators for those at the top of the income distribution. “Rather than see a sizable portion of their estates subject to taxation, wealthy families give while living to reduce the size of their estates; and they also give in the form of bequests upon their death, “ the NCRP says.

The Chronicle of Philanthropy has compiled detailed data on publicly reported charitable gifts of $1 million or more in each state. The largest recipients include private and community foundations, colleges and universities, healthcare programs, the arts, museums and libraries. The Chronicle assumes that a large proportion of those donations is motivated by estate tax planning.

So Oregon charities relying on big gifts may be in for a harder struggle going forward.

The Chronicle data shows the following significant gifts of $1 million or more to Oregon institutions just in 2017 and 2016:

2017

Donor Recipient Gift Value
Anonymous U. of Oregon (Eugene) $50,000,000
Anonymous Oregon State U. at Corvallis $25,000,000
Robert W. Franz Providence Health and Services (Portland, Ore.) $20,000,000
Michael and Arlette Nelson U. of Portland (Ore.) $10,000,000
Anonymous Oregon State U. at Cascades (Bend) $5,000,000
Fariborz Maseeh Portland State U. (Ore.) $5,000,000
Jordan Schnitzer Family Foundation (Jordan Schnitzer) Portland State U. (Ore.) $5,000,000
Anonymous U. of Oregon, Jordan Schnitzer Museum of Art (Eugene) $2,250,000
Keith and Julie Thomson U. of Oregon (Eugene) $2,000,000
Tim and Mary Boyle Providence Foundations of Oregon (Lake Oswego) $2,000,000
Tykeson Family Foundation (Don Tykeson) Oregon State U. at Cascades (Bend) $1,000,000
Robert W. Franz Blanchet House of Hospitality (Portland, Ore.) $1,000,000
Charles McGrath Oregon State U. at Cascades (Bend) $1,000,000

Note: Most of the bequests listed in this database are estimates. In many cases, donors’ bequests are announced long before their wills are settled.


2016


Donor Recipient Gift Value
Philip H. and Penelope Knight U. of Oregon (Eugene) $500,000,000
Gary and Christine Rood Oregon Health & Science U. (Portland) $12,000,000
Charles and Gwendolyn Lillis U. of Oregon (Eugene) $10,000,000
Philip H. and Penelope Knight Fanconi Anemia Research Fund (Eugene, Ore.) $10,000,000
Tim and Mary Boyle U. of Oregon (Eugene) $10,000,000
Allyn C. and Cheryl Ramberg Ford U. of Oregon (Eugene) $7,000,000
Edward and Cynthia Maletis U. of Oregon (Eugene) $5,000,000
Roberta Buffett and David Elliott Oregon Shakespeare Festival (Ashland) $5,000,000
Don and Willie Tykeson John G. Shedd Institute for the Arts (Eugene, Ore.) $2,000,000
Tim and Mary Boyle Reed College (Portland, Ore.) $2,000,000
David and Anne Myers Columbia River Maritime Museum (Astoria, Ore.) $1,000,000


Note: Most of the bequests listed in this database are estimates. In many cases, donors’ bequests are announced long before their wills are settled.

Source: Philanthropy.com; http://bit.ly/2lljb8m


.


Reducing the home mortgage interest deduction: enough with the crocodile tears


homemortgageinterest

A Christie’s International Real Estate warning.

The tax bill just passed by the Senate would let new homeowners continue to claim a deduction for the interest they pay on mortgage debt of up to $1 million. Under the House bill, existing homeowners could continue writing off interest paid on mortgage debt up to $1 million, but new mortgages would be subject to a $500,000 cap.

The House provision would be calamitous, tragic, disastrous, critics argue.

Reducing or eliminating the mortgage interest deduction “will hurt millions of hard-working American families and marginalize homeownership,” said Granger McDonald, Chairman of the National Association of Realtors.

Slicing the home mortgage interest deduction could lead to a housing recession, said Jerry Howard, CEO of the National Association of Home Builders.

Let’s get real here.

The change proposed by the House wouldn’t really mean much to many taxpayers. You have to itemize deductions to claim the deduction on your tax return now. Only about one-third of taxpayers now itemize and only three-quarters of those claim a mortgage interest deduction, according to the Urban-Brookings Tax Policy Center.

But that would change because the tax bill would almost double the standard deduction, from $12,700 to $24,000 for married couples and from $6,350 to $12,000 for single filers. With this change, fewer taxpayers would benefit from the mortgage interest deduction. The Tax Policy Center figures the share of households claiming the home mortgage interest deduction would drop to 4 percent. That’s right. Just 4 percent.

That drop would also reflect the fact that, despite a lot of high cost homes in the Portland Metro Area, it’s pretty easy to buy a home for less than $500,000 in most of the rest of Oregon and the nation.

For example, the median home value is $251,100 in Tillamook, $336,600 in Corvallis and $162,300 in Pendleton.

According to the Mortgage Bankers Association, Americans who applied for a mortgage to buy a home in January 2017 were looking for a loan sized at an average of $309,200. The median home value in the United States is only $203,400, according to Zillow.


State Home Values

NAME MEDIAN Zillow Home Value Index
California $469,300
New York $267,100
Florida $192,600
Illinois $163,100
Texas $159,000
Pennsylvania $155,000


Georgia $149,300
Michigan $126,100
Ohio $122,400

Only 5.4% of all loans originated in 2017 have been for more than $500,000, according to ATTOM Data Solutions. That’s just 325,000 loans, most of which went to the wealthy.

Want to know the median list price by city, state, zip code, and neighborhood? Zillow’s Home Value tool provides that data.

The three states with the highest percentage of home mortgage loans over $500,000 in 2017 have been Washington, D.C. (35.1%), Hawaii (15%) and California (11.5%), followed by Delaware, Massachusetts and Washington state at about 9%.

They’re the ones who would see their ox gored under the House bill, and it’s the members of Congress from these states in the forefront of wanting to preserve the $1 million level.

In Democrat-dominated California, the pain would be noticeable. In the San Jose metropolitan area, 75% of new mortgage loans as of early November 2017 were for more than $500,000 and the median home price was more than $1 million, according to an analysis by CoreLogic Inc. In the San Francisco metro area, 60% of new loans were for more than $500,000.

“I think that harming the ability for Americans to own their home is like attacking motherhood and apple pie,” Rep. Judy Chu (D-Monterey Park), who represents an area that includes Pasadena and much of the San Gabriel Valley, told the Los Angeles Times.

So what the Senate is doing is defending a tax break that mostly benefits a small number of affluent homeowners and distorts the housing market?

The distortion occurs because the tax reduction increases the price of housing. Well-off buyers are willing to pay more because they anticipate deducting their mortgage interest, effectively lowering their monthly house payments.

”… there’s good evidence that cutting back the mortgage-interest deduction would lower prices in high-cost areas, where newcomers find it difficult to move nowadays,” asserts Howard Husock, vice president for research and publications at the Manhattan Institute.

So enough with the weeping and wailing. Reducing the home mortgage interest deduction would be a good thing.

Gov. Brown’s new solar power orders are a stealth tax.

Gov. Kate Brown must figure that if Barack Obama could govern by executive order, so can she.

So right before she was to head for Germany to attend the United Nations climate talks she imposed new taxes through Executive Orders 17-20 and 17-21 with absolutely no public debate.

brownsolar

Yeah, higher housing costs!

Brown doesn’t call her Executive Orders a tax. She calls them a direction to the state Department of Business and Consumer Services’ Building Code Division (BCD) to amend the state’s codes with respect to making new residential and commercial structures “solar ready”. She also mandated that all new parking structures for home and commercial buildings be wired for a charger for an electric vehicle by October 2022.

But all this will cost builders extra money, and they will pass those costs on to homebuyers and building users.

So, at a time when the state is struggling with a lack of affordable housing, Gov. Brown is unilaterally imposing additional costs on Oregonians to burnish her credentials with the environmental lobby. Would those now endorsing Brown’s move be as pleased if she had unilaterally eliminated some environmentally- friendly sections of the state’s building code?

There is always a cost associated with retrofitting a building to accommodate solar. With the proper solar ready preparations, these measures may cost less if done at the time of building construction. But the decision on whether to impose a requirement for solar ready structures should be made in a public process.

Building code amendments are typically accomplished by legislative action or the adoption of proposals from the public. Legislative action takes time and requires public hearings. If a member of the public proposes an amendment, the Division insists that proposals:

  1. Be shared with people and organizations that will be impacted.
  2. Be accompanied by substantiating evidence or information to support the change
  3. Include the cost impact the change would have on building construction.

Brown didn’t bother with any of these steps, including projecting costs. She probably doesn’t know what all this is going to cost….or care..

Oregonians should see Brown’s move for what it is, a new tax on homebuyers and a dangerous level of executive overreach.


.


Virginia’s Nov. 7 election: rural vs. urban is the story

urbanrural

Democrats sweep in Virginia…as voters reject ‘Trumpism’, “ said OregonLive.

I’m not sure it’s that simple.

If you look at maps that break down election results by county in Virginia you will quickly see that it wasn’t so much Trumpism vs. Liberals as urban vs. rural. The Democratic gubernatorial candidate won by sweeping heavily liberal urban areas, but lost by big margins in rural areas.

It reminds me of statewide Oregon elections.

In 2016, when Kate Brown won the race for governor, her win was derived almost entirely from higher population urban areas, including counties with academic centers, such as the University of Oregon (Lane County) and Oregon State University (Benton County)

brownmap2

BLUE: Kate Brown; RED: Bud Pierce

John Kitzhaber’s 2014 race against Dennis Richardson followed the same pattern:

govenorsracepng

BLUE: Kitzhaber; RED: Richardsonn

Now look at the results of the Nov. 2017 governor’s race in Virginia, where voters chose Democrat Ralph Northam over Republican Ed Gillespie 54 percent to 45 percent.

votesharemapvirginia

RED: Gillespie    BLUE: Northam

The New York Times reported  that Lt. Gov. Ralph S. Northam won the race against Republican Ed Gillespie with huge margins in vote-rich metropolitan Virginia, and especially the populous Washington suburbs in Northern Virginia.

For example, in Northern Virginia’s Fairfax County, Virginia’s largest county (and where I used to live when working in Wash., D.C.) twice as many voters supported Northam than Gillespie. Northam also carried Northern Virginia’s Loudoun County by more than 23,000 votes — a 20-point spread.

Maps on the New York Times website  also show Northam’s big vote advantages in other urban areas, including Richmond (The State Capitol), Norfolk (Home to the largest U.S. Navy base in the world, Naval Station Norfolk, and one of NATO’s two Strategic Command headquarters, Roanoke ( Roanoke College , Hollins University and Virginia Tech  are in the area), and Harrisonburg (home to James Madison University, with an enrollment of 21,000 students).

Northam also did well in southeastern Virginia, where the state’s large black population is heavily concentrate. Northam also comes from Virginia’s eastern shore,

Meanwhile, Gillespie rolled up huge margins in rural areas, sometimes 70-80 percent of the vote. In southwest Virginia’s Scott County, for example, Gillespie took 81.4 percent, Northam 17.7 percent. The problem is all the rural areas couldn’t override Northam’s vote in populous urban areas.  Gillespie’s win got him just 4996 votes in Scott County., while Gillespie’s 67.9 percent win in Fairfax County got him 254,919 votes.

“Rural Virginia, mostly stuck with the GOP brand and backed Gillespie at almost the same levels as Trump,” Geoffrey Skelley, associate editor of Sabato’s Crystal Ball at the University of Virginia Center for Politics, told the New York Times. “However, the problem for the rural areas is that Gillespie didn’t make any inroads in the Urban Crescent, meaning that the more urban and suburban parts of the state trumped the heavily Republican vote in areas such as Southwest Virginia, Southside, and the Shenandoah Valley.

This election suggests that the state’s politics may remain very polarized, with urban areas being very Democratic, suburban and exurban areas leaning Democratic, and rural areas voting heavily Republican.”

In other words, despite the Democrat’s success this week, it’s no sure thing that 2018 will see a Democratic sweep.


/

]’;

Just Say No! Stop Gov. Brown from helping former legislators cash in on PERS

GovBrownFastOne

What, me try to pull a fast one?

Oregon’s Senate Rules Committee needs to straighten up and fly right when it considers proposed appointments by Gov. Kate Brown one week from today.

Brown has nominated Sen. Richard Devlin (D-Tualatin) and Sen. Ted Ferrioli (R-John Day) to the Northwest Power & Conservation Council, a federally funded panel that provides policy and planning leadership on regional power, fish and wildlife issues.

The Senate Rules Committee is scheduled to consider the nominations on Nov. 13. It should just say no.

If the two men, neither of whom have power and conservation expertise, are approved for the Council positions, not only will they each make $120,000 a year, but they’ll likely end up exploiting PERS for big payouts. That’s because their pensions will be calculated using their new high salaries, potentially rewarding them with hundreds of thousands of extra dollars. This when PERS is already overwhelmed with billions of dollars in unfunded liabilities.

I remember when smug Enron executives tried to intimidate Oregon Public Utility Commissioners in an effort to secure approval for Enron’s takeover of PGE. Commissioner Joan H. Smith blasted the Enron people at a hearing for assuming Oregonians were simple-minded country bumpkins . “Do you think we all just fell off a turnip truck,” she said.

Gov. Brown must think the members of the Senate Rules Committee just did.

Members of the Senate Interim Committee on Rules and Executive Appointments


Chair Senate Majority Leader Ginny Burdick
Vice-Chair Senate Republican Leader Ted Ferrioli
Member Senator Lee Beyer
Member Senator Brian Boquist
Member Senator Arnie Roblan


Abuse of Power: Gov. Kate Brown’s PERS Payoff

Kate Brown

Why is Gov. Kate Brown laughing?

Co-conspirators Gov. Kate Brown (D), Sen. Richard Devlin (D-Tualatin) and Sen. Ted Ferrioli (R-John Day) have concocted a bipartisan scheme to enrich the legislators and fleece the Public Employees Retirement System (PERS).

This while a task force appointed by Gov. Brown has been trying to determine the best ways to slash the the crushing PERS debt by $5 billion. The task Force’s report is expected to be submitted on Nov. 1. The PERS Board has predicted that if solutions aren’t found, PERS costs could rise from 17 percent of state and local government annual payrolls to 34 percent in 2021. That would be likely to force worker layoffs.

And you thought Oregon was a corruption-free state.

On Oct. 23, Brown nominated Devlin and Ferrioli to the Northwest Power & Conservation Council, a federally funded panel that provides policy and planning leadership on regional power, fish and wildlife issues. The Senate Rules Committee is scheduled to consider the nominations on Nov. 13.

Neither legislator will bring any expertise in regional power, fish and wildlife issues to the Council. Devlin, 65, is a retired corrections officer and private investigator. Ferrioli, 66, is a retired public relations executive.

But their lack of expertise is not the most egregious issue. It’s their exploitation of the public purse.

First, the council positions come with a $120,000 annual salary, substantially more than Devlin and Ferrioli have been making from their legislative salaries.

Second, as The Oregonian’s Ted Sickinger reported this past week, both men will be raiding PERS for big payouts.

The jobs “…will allow both legislators to double dip, turbocharge their public pensions, or both,” Sickinger reported.

This is how Sickinger put it:

“Ferrioli already draws a $33,083 annual pension from the Public Employees Retirement System. That benefit stems from 6½ years working for the Oregon Department of Veterans Affairs in the late ’70s and early ’80s…And because he is already at retirement age, he is allowed to double dip, continuing to collect it while working full time at the council.

Meanwhile, Ferrioli is eligible for a separate pension for his 20 years of legislative service. And if his Senate colleagues confirm him to the new position, that pension will be calculated using his new higher salary and the extra years of service he earns at the power council, according to PERS.

It’s unclear how much service credit Ferrioli earned during his years at the Legislature, given the part-time work. But assuming he sticks with the job for the first three-year term, the new salary could quintuple his legislative pension, which could translate to hundreds of thousands of dollars in extra benefits over the course of his retirement (emphasis mine). And he could start drawing that while continuing to work at the council.

Devlin, too, could see a similar multiplier in his legislative pension if confirmed. He, too, has 20 years of legislative service and is eligible to start drawing his pension. But if he holds off, the new salary and service at the power council would balloon those benefits after three years.”

This brazen attempt to exploit PERS, which Brown, Devlin and Ferrioli know is already in deep trouble, needs to be cut off at the pass.

If they want to maintain their reputations as public servants, Devlin and Ferrioli should either decline the Council appointments or they should refuse any additional PERS benefits that may arise because of them.

Gov. Brown needs to stop taking Oregonians for rubes. It’s time to put a stop to this abuse of the system.


Dereliction of duty: How bad does it have to get before you shut down a failing virtual charter school?


badapple

Millions of taxpayer dollars! Appalling test scores! Horrific graduation rates!

Why are Insight School of Oregon – Painted Hills and Oregon Virtual Academy, both virtual charter schools run by K12 Inc., a for-profit, online education company, still operating?

Why are we letting this happen to our children?

Insight opened its doors in Oregon in 2012 as Insight School of Oregon Charter Option, sponsored by the Crook County School District in Central Oregon.

To operate the school, its board contracted with K12, Virtual Schools LLC, a wholly owned subsidiary of publicly traded for-profit K12 Inc. (LRN [U.S.:NYSE] ). K12 Inc. runs 58 separate virtual charter schools across the country. The company reported revenues of $888.5 million for the Year Ended June 30, 2017.

Insight’s Oregon headquarters was located in a nondescript one-story office building at 603 NW. 3rd St. in Prineville.

In its first three years, Insight’s K-12 enrollment grew to more than 500 students from around the state.

But all was not well.

K12 Inc. says its education program “is proven effective,” but the numbers told a different story to the Crook County School District. Even though the district netted $231,592 in the first year of its contract with Insight and $436,554 in the second, it began to have serious reservations about continuing the relationship.

In Nov. 2014, the Crook County School District sent a blistering letter to Insight expressing grave concerns about the school’s operations and academic performance.

School Superintendent Dr. Duane Yecha and school board Chair Doug Smith told the school they had major concerns about Insight’s: inadequate tracking of student attendance and enrollment; academic achievement; poor test participation; low four-year graduation rate (16.18 percent in 2013-2014); and failure to meet financial requirements stipulated in the district’s contract with Insight.

“…these issues have given the district reason to consider whether Insight is able to meet its ongoing obligations under the Charter Agreement and under ORS Chapter 338,” the letter said.

In 2015, even though the district was set to net $480,710 from its sponsorship of Insight in the 2014 – 2015 school year, it decided not to renew the sponsorship.

So Insight went shopping.

It quickly found a new partner, signing a sponsorship contract with the Mitchell School District 55 on April 29, 2015. The district had just one school serving a few local kids, some teens from around Oregon and high school students from Germany, Thailand, and Hong Kong. The 20 international and regional students all lived in a school dormitory at the school.

With a new sponsor in hand, Insight changed to a grade 7-12 school and renamed itself Insight School of Oregon – Painted Hills.

insightlogo

According to an audit by the Oregon Secretary of State’s office, Insight’s contract with Mitchell School District 55 removed school performance goals included in the the Crook County School District’s charter contract. Also removed was a requirement that Insight submit a written plan of correction if it did not meet the performance goals.

Academic performance didn’t change for the better, based on Report Cards by the Oregon Department of Education.


In the 2014-2015 school year, the last with the Crook County School District, only 16.4 percent of the students tested in Mathematics and 48.1 percent of those tested in English Language Arts met the state standard for college/career readiness. Just 37.8 percent met or exceeded state standards in Science.

On top of all this, the graduation rate was a horrific 19.1 percent.

In the 2015-16 school year, the first under the Mitchell School District, scores in Mathematics and English Language Arts got worse and science scores were only marginally better

Only 8.0 percent of the students tested in mathematics and 36.7 percent of those tested in English Language Arts met the state standard for college/career readiness. Just 45.5 percent met or exceeded state standards in Science.

Poor academic performance may have been due, in part, to the high absentee rate, the percentage of the school’s students who missed more than 10 percent of school days during the 2015-2016 school year. Insight’s rate was an extraordinary 66 percent, compared with 18.7 percent statewide

The lowest rate of absenteeism, 45 percent, occurred with 7th grade students, the highest , 86 percent, with 12th graders.

In 2016-17, with the school reporting enrollment of 390 students, performance in English Language Arts improved to 47.1 percent meeting the state standard for college/career readiness, though this was still far below the 60.9 percent performance of all schools statewide. Mathematics performance increased, but from an abysmal 8.0 percent to an abysmal 14.9 percent. Science dropped precipitously from 45.5 percent to 25.0 percent, compared with 60.5 percent statewide.

Other 2016-17 numbers were pretty weak, too. Only 34.5 percent of freshmen were on track to graduate in four years, up from  13.2 percent in 2015-16, but still pitiful compared with 83.4 percent of students at all schools statewide.

Meanwhile the percent of the school’s students that dropped out during the school year and didn’t re-enroll leaped to an almost unbelieveable 75.6 percent in 2016-17, compared with 49.8 percent in 2015-16.

To top it off, the graduation rate, students earning a standard diploma within four years of entering high school, sank from an already horrific 19.1 percent in 2014-15 to 11.8 percent in 2015-16. The graduation rate for 2016-17 is not yet available.

Even the share of students earning a regular, modified, extended, or adult high school diploma or completing a GED within five years of entering high school was just 27.7 percent, challenging the assertion that low 4-year graduation rates are due to credit deficiencies when students enroll.


oregonvirtualacademy

Another virtual charter school in Oregon powered by K12 Inc. is Oregon Virtual Academy (OVA), sponsored by North Bend School District 13.  “Oregon Virtual Academy awakens the power of learning in students through a personalized program of engaging courses, caring teachers, and a vibrant school community,” says the school’s website.

But, as at Insight, that awakening doesn’t appear to have brought about academic excellence, or even middling success.

For the 2015-16 school year, the North Bend School District received ​$14,874,303 ​from the State School Fund because of its sponsorship of OVA. The District retained $961,681 of that money and forwarded $13,912,622​ to OVA. OVA’s distribution was likely larger in 2016-17 because of increased enrollment.

But who was being taught with all that money? During the 2015-16 school year, OVA’s absentee rate was 41 percent. The lowest rate of absenteeism, 12 percent, was with 1st graders, the highest rate, 68 percent, with 12th graders.

And its academic performance is dreadful, contrary to an assertion by Interim Head of School Dr. Debbie Chrisop that “ORVA provides an education that meets or exceeds state standards, and students demonstrate their knowledge and skills through state standardized tests.”

With enrollment of 2,142 students from nearly every county in Oregon during 2016-17, only 47.9 percent of those tested in English Language Arts and 23 percent of those tested in Mathematics met the state standard for college/career readiness. Fewer than half, 44.1 percent, met or exceeded the state standard in Science. Worse, the Mathematics and Science scores have been going down each year for the past three years.

OVA’s graduation rate for in 2016 was just 28.3 percent, placing it among the worst performing 5 percent of all public schools in the state. Its 2017 rate has not yet been released.

Jessica Schuler, K12’s Corporate Communications Manager, offered the same explanation for the low graduation rates as other virtual charter schools. Every high school student enrolled in Insight School transferred in from another school or education program, she said. Furthermore, high percentages of these students enter behind in credits and not on track to graduate on time. The federal four-year cohort graduation rate does not account for this, she said.

The four-year cohort graduation rate unfairly penalizes schools with high mobility that serve under-credited transfer students (The grad rate of the sending school/district is not affected), Schuler said.  Even though these transfer students successfully earn high credits at Insight, they are unable to graduate “on time” in their four-year cohort, thus negatively impacting Insight’s grad rate.

A problem with this explanation is that even the share of students earning a regular, modified, extended, or adult high school diploma or completing a GED within five years of entering high school was just 42.8 percent, compared with 81.9 percent at all public schools statewide. Again, this challenges the common assertion that low student performance is due to the enrollment of many students who are credit deficient.

Excuses, excuses.

The fact is, full-time virtual schooling is the wrong solution for many young people, particularly those who are already struggling in a traditional hands-on school.

“Current online charter schools may be a good fit for some students, but the evidence indicates that online charters don’t serve very well the relatively atypical set of students that currently attend these schools, much less the general population,” said Stanford’s Center for Research on Education Outcomes (CREDO) in a 2015 report. “Academic benefits from online charter schools are currently the exception rather than the rule.”

In the same vein, a 2017 report from the Colorado-based National Education Policy Center (NEPC) concluded, “There is…little high-quality systematic evidence that the rapid expansion of (virtual charter schools) the past several years is wise. Research has …consistently found that students enrolled in full-time virtual schools have performed at levels well below their face-to-face counterparts.”

A 2016 Fordham Institute study of virtual charter schools reached similar conclusions. “Online schools offer an efficient way to diversify—and even democratize—education in a connected world,” the study said. “Yet they have received negative, but well-deserved, attention concerning their poor academic performance, attrition rates, and ill capacity to educate the types of students who enroll in them.”

Gov. Kate Brown and state legislators constantly reaffirm their commitment to ensuring Oregonians receive a quality education and that public dollars are spent wisely.

If these politicians mean what they say, why are these two schools being allowed to continue sucking up Oregon taxpayer dollars while failing to adequately educate Oregon children?

It’s time for the Oregon Legislature to act on failing virtual charter schools . The next session, which starts Feb. 1, 2018, will be a good time to start.


READ MORE about Oregon charter schools:

Virtual Charter Schools Don’t Compute

Too many Oregon virtual charter school students skip state tests

PERS problems? Some charter schools say, “Fugettaboutit”


PERS problems? Some charter schools say, “Fugettaboutit”

PERSlogo

Oregon’s traditional public schools may be struggling with escalating pension costs, but some charter schools aren’t worried. They’ve figured a way out.

Oregon’s charter school law says public charter schools are public employers, so teachers and staff are required to participate in PERS, the Public Employees Retirement System.

For charter schools, that has traditionally meant teachers and staff were required to contribute a percentage of their pay to PERS and the employing agency had to match these contributions with a percentage of total payroll. The problem is employer contribution rates have been escalating, imposing an increasing burden on charter school budgets.

In early 2011, after PERS announced an increase in the employer contribution rate, Kings Valley Charter School, sponsored by the Philomath School District, worried that increases would force the school to reduce its operations or even close.

kingsvalleycharterschool

In Sept. 2000, an opinion from Oregon Attorney General Hardy Meyers declared the following:

  1. Under ORS chapter 338, may a public charter school contract out its operations to a private, for-profit entity? Yes, assuming that the contract is consistent with the terms of the charter and all applicable laws.
  2. Would contracting out a public charter school’s operational responsibilities to a for-profit entity violate the Oregon Constitution because it would result in the loss of governmental accountability for the performance of governmental functions? No, but in order for a public charter school’s contracting out of the school’s operations to a private, for-profit entity to be constitutional, the public charter school must :(1) maintain a right of control over delegated governmental functions; (2) provide procedural safeguards to affected members of the public in relation to those aspects of the school’s operations that constitute the governmental function of providing a public education.

A non-profit group, People Sustaining Kings Valley (PSKV), was formed to come to Kings Valley’s rescue as an independent contractor. At the start of the 2011-2012 school year, the school contracted with PSKV to have it hire 35 of its 36 employees, everybody but the school’s director. The school subsequently agreed to pay PSKV $973,637 for specified services that school year, including providing instructors and teacher assistants.

With that move, the teachers and staff, as private employees of PSKV, were no longer required to participate in PERS, saving the school about $80,000 a year in PERS contributions.

This also allowed teachers and staff to participate in a pension program provided by PSKV. Under the new system, PSKV automatically contributes 6 percent of the employee’s salary to a 403b retirement plan and the employee can decide whether to contribute more.

“The school has received considerable positive feedback from the teachers and staff regarding the new arrangement,” reported a Jan-Feb. 2013 Charter Starters Newsflash, though it wasn’t at all clear whether the end retirement benefit with the 403b, which would vary with the market, would be better or worse than a PERS benefit.

As for PERS itself, the impact of decreased member participation resulting from any PERS employer engaging “independent contractors” who are not eligible for PERS participation rather than “employees” who are eligible for PERS participation is somewhat neutral, PERS says.

Generally speaking, to the extent any public employer has more “employees” participating as members of PERS it would help to decrease the unfunded actuarial liability (UAL) in the short term because of the corresponding contribution payments. However, it would also increase the future pension liability in the long run because of the increased benefit obligations accrued by those members. Conversely, if a public employer has less employees participating in PERS it would not help decrease the UAL in the short-term, however, neither would it increase the future pension liability.

logoslogo

Logos Public Charter School, sponsored by the Medford School District, has a similar arrangement with a private company, Western Collegiate Consulting (WCC). On its website, WCC says it is “a state certified Professional Employment Organization (PEO) that was specifically created to provide charter schools in Oregon… qualified teachers and staff …”

WCC registered with the Oregon Secretary of State as an Eagle Point, OR business on Oct. 28, 2015. In a rather interesting relationship that could pose a conflict of interest, the Chief Executive Officer of WCC is Joseph D. VonDoloski, who was a principal organizer of Logos and served as its Executive Director until Aug. 2017. VonDoloski left Logos and simultaneously, as CEO of WCC, hired all its teachers and staff.

Logos entered into a 30-page contract with WCC on August 1, 2017, according to Cassie Zimmerer, WCC’s Chief Human Resources Officer. Logos’ former business manager, she is the daughter of Logos’ current Executive Director, Sheryl Zimmerer.

“As part of the agreement, WCC onboarded the majority of Logos’ previous existing employees and hired approximately 10-15 more individuals to fit the school’s needs for next year,” Cassie Zimmerer said. She added that WCC WCC offers a benefit package to it’s employees which includes a 401k matching program (up to 6%) that employees are fully vested in day #1.

The Medford School District subsequently raised the conflict of interest issue. It also questioned whether Logos had complied with state contracting statutes when it contracted with WCC. Those statutes, Medford asserted, require Logos to show using WCC is more cost effective than using its own personnel and resources or that it wasn’t feasible for Logos to use its own personnel.

According to the Oregon Government Ethics Commission, the Medford School District has filed an ethics complaint with the Commission over the situation and the Commission is currently conducting a review.

______

READ MORE about charter schools:

Virtual Charter Schools Don’t Compute

Too many Oregon virtual charter school students skip state tests