Two Oregons are alive and well.
All Knute Buehler needed to do on Nov. 5 was look at the county-by-county maps of Oregon’s past gubernatorial elections to see that he had a tough row to hoe to become Oregon’s next governor.
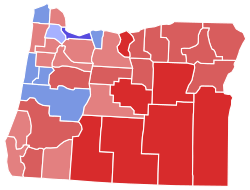
Take a look at a map of the 2014 election for governor:
John Kitzhaber: Blue; Dennis Richardson: Red

And here’s a map of the 2010 election for governor:
John Kitzhaber: Blue; Chris Dudley: Red
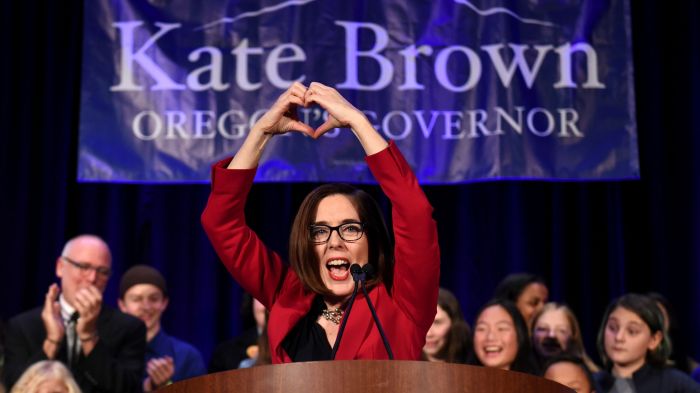
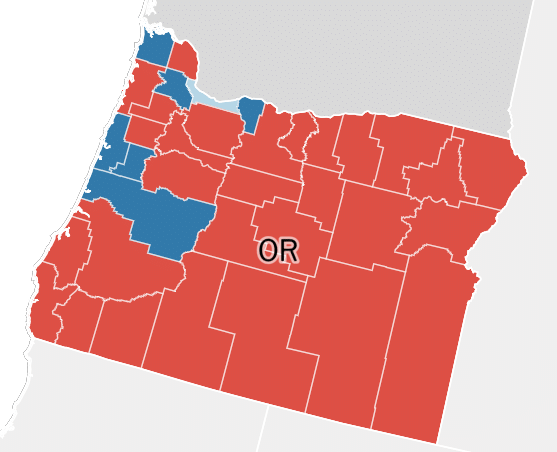
The 2018 election played out in the same pattern, with the Democrat (Kate Brown in this case) carrying Lane, Benton, Lincoln, Clatsop, Washington, Multnomah and Hood River counties.
And, as in the past, Multnomah County really saved the Democrat’s bacon, giving Brown at least 241,524 votes and Buehler only 71,903. That kind of margin for Brown is pretty hard to overcome.
Buehler overwhelmed Brown in counties such as Linn, Douglas, Josephine, Coos, Klamath, Umatilla, Union and Crook, but the voting population of these counties was far too small to swing the election in Buehler’s favor.
Nov. 6, 2018 Election Results for Governor of Oregon
| County | Brown | Buehler | Starnes | Rpt. |
|---|---|---|---|---|
| Multnomah |
241,524
|
71,903
|
5,334
|
93% |
| Clackamas |
85,679
|
93,823
|
4,472
|
92 |
| Washington |
104,056
|
74,934
|
4,097
|
63 |
| Lane |
94,957
|
66,690
|
5,584
|
100 |
| Jackson |
41,233
|
50,738
|
4,126
|
93 |
| Marion |
43,178
|
50,557
|
2,799
|
100 |
| Deschutes |
39,050
|
48,300
|
2,662
|
100 |
| Linn |
15,894
|
32,182
|
2,213
|
100 |
| Douglas |
11,536
|
31,878
|
2,421
|
89 |
| Yamhill |
17,274
|
23,705
|
1,458
|
91 |
| Benton |
26,023
|
14,645
|
1,190
|
100 |
| Josephine |
11,797
|
23,808
|
1,679
|
83 |
| Polk |
14,799
|
18,603
|
1,033
|
100 |
| Coos |
9,442
|
16,231
|
1,263
|
100 |
| Klamath |
6,190
|
18,863
|
1,348
|
91 |
| Lincoln |
12,367
|
9,738
|
803
|
100 |
| Umatilla |
6,941
|
14,987
|
874
|
100 |
| Clatsop |
8,389
|
7,834
|
576
|
100 |
| Columbia |
6,582
|
8,867
|
679
|
61 |
| Tillamook |
5,569
|
6,561
|
458
|
100 |
| Union |
2,854
|
7,941
|
439
|
84 |
| Crook |
2,234
|
8,423
|
417
|
88 |
| Curry |
4,056
|
6,365
|
435
|
96 |
| Wasco |
4,476
|
5,753
|
418
|
100 |
| Hood River |
6,286
|
3,711
|
263
|
100 |
| Malheur |
2,122
|
5,960
|
362
|
100 |
| Jefferson |
2,564
|
5,427
|
379
|
100 |
| Baker |
1,557
|
5,995
|
345
|
100 |
| Grant |
641
|
2,919
|
151
|
80 |
| Wallowa |
1,018
|
2,511
|
136
|
92 |
| Morrow |
829
|
2,510
|
162
|
80 |
| Harney |
577
|
2,714
|
124
|
67 |
| Lake |
415
|
2,411
|
141
|
74 |
| Gilliam |
218
|
690
|
46
|
100 |
| Sherman |
188
|
729
|
32
|
100 |
| Wheeler |
158
|
593
|
38
|
100 |
| Source: New York Times | ||||
